Ascending Triangle Pattern – Definition and How To Trade It


The ascending triangle pattern is a popular chart pattern used in technical analysis to identify potential bullish breakouts in the market. Traders and investors often use this pattern to make informed decisions about buying or selling assets.
In this blog post, we will explore the definition of the ascending triangle pattern and discuss how to trade it effectively.
What Is an Ascending Triangle Chart Pattern?
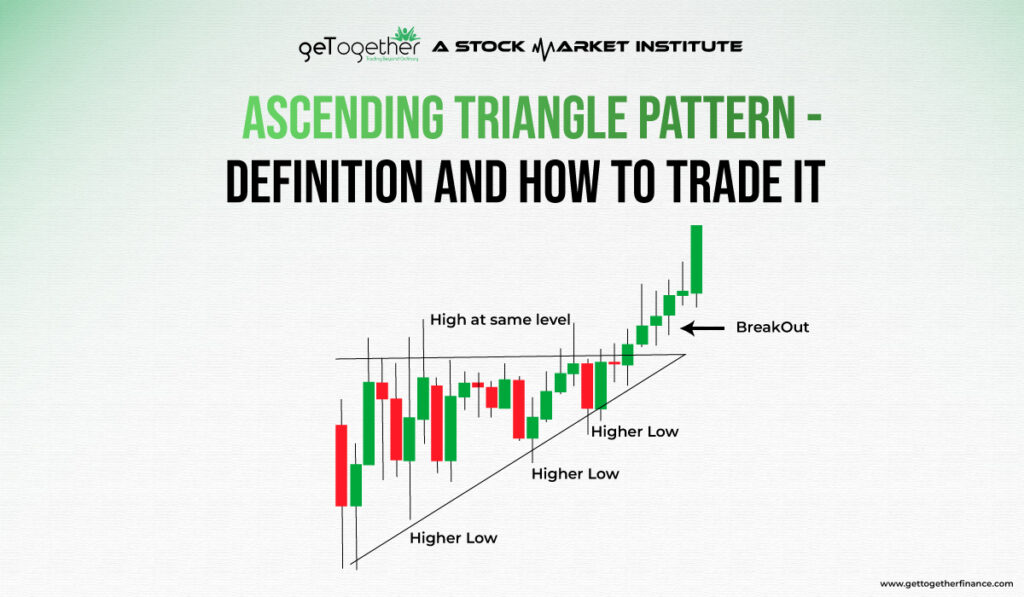
An ascending triangle chart pattern is formed when there is a horizontal resistance level and a rising trendline that converge toward each other. This pattern indicates that buyers are becoming more aggressive and are gradually pushing the price higher, while sellers are unable to push the price below the rising trendline. The horizontal resistance level acts as a barrier that needs to be broken for a potential bullish breakout.
Understanding Ascending Triangle Chart Pattern

To identify an ascending triangle chart pattern, traders look for the following characteristics:
Trendlines: Draw a trendline connecting the higher lows, representing the rising support level. Then, draw a horizontal line connecting the swing highs, forming the resistance level.
Convergence: The trendline and the horizontal resistance level should converge towards each other, forming a triangle-like shape.
Volume: During the formation of the pattern, the volume tends to decrease. However, as the breakout occurs, there is often a noticeable increase in volume, indicating strong buying pressure.
Traders use the ascending triangle pattern to anticipate potential bullish breakouts. The pattern suggests that buyers are gaining control and the price may break above the horizontal resistance level, leading to an upward move in the asset’s price.
About the ascending triangle pattern:
Breakout Confirmation: The breakout from the ascending triangle pattern is considered confirmed when the price convincingly closes above the horizontal resistance level. Traders often look for a substantial increase in volume accompanying the breakout as it signifies strong buying interest and confirms the validity of the pattern.
Duration: The duration of the ascending triangle pattern can vary. Some patterns may form over a few weeks, while others can take several months to develop. The longer the pattern formation, the greater the potential significance of the breakout.
Pullbacks: It’s common for the price to experience pullbacks towards the rising trendline within the ascending triangle pattern. These pullbacks provide opportunities for traders to enter or add to their positions at more favorable prices. However, it’s important to note that the price should not break below the rising trendline during these pullbacks, as it may indicate a failed pattern.
Target Price: As mentioned earlier, traders often use a measured move technique to calculate the target price following a breakout from the ascending triangle pattern. The height of the triangle is measured from the horizontal resistance level to the rising trendline. This distance is then added to the breakout point to estimate the potential upward move. However, it’s crucial to remember that the target price is not a guaranteed level and should be used as a guide rather than an absolute prediction.
Stop Loss: To manage risk, traders typically place a stop-loss order below the rising trendline or the recent swing low within the ascending triangle pattern. This helps to limit potential losses in case the breakout fails, and the price reverses.
Volume Analysis: While the decrease in volume during the formation of the ascending triangle is a common characteristic, traders also pay attention to the volume during the breakout. A substantial increase in volume during the breakout indicates strong market participation and adds confidence to the validity of the pattern.
Confirmation from Other Indicators: Traders often combine the analysis of the ascending triangle pattern with other technical indicators to increase the probability of successful trades. For example, they may use oscillators like the Relative Strength Index (RSI) or Moving Average Convergence Divergence (MACD) to confirm the strength of the breakout or identify potential divergences.
Also Read: Descending Triangle Pattern
Other Types of Triangle Chart Patterns

While the ascending triangle pattern is one of the most commonly traded chart patterns, it’s essential to be aware of other triangle chart patterns as well. Here are two other types of triangle patterns:
Symmetrical Triangle
A symmetrical triangle pattern occurs when the price forms both a rising trendline and a falling trendline, resulting in a converging triangle shape. This pattern indicates a period of consolidation and indecision in the market, with no clear bullish or bearish bias. Traders often wait for a breakout above or below the triangle to determine the direction of the next significant move.
Descending Triangle
In contrast to the ascending triangle pattern, a descending triangle pattern forms when there is a horizontal support level and a declining trendline. This pattern suggests that sellers are becoming more aggressive, consistently pushing the price lower, while buyers struggle to break above the declining trendline. Traders watch for a breakdown below the horizontal support level for a potential bearish move.
Examples of other technical indicators that traders commonly use in conjunction with the ascending triangle pattern:
- Relative Strength Index (RSI): The RSI is a popular momentum oscillator that measures the speed and change of price movements. Traders often use the RSI to confirm the strength of the breakout from the ascending triangle pattern. If the RSI is in an overbought condition (above 70), it may suggest that the price has rallied too far and a pullback or consolidation is likely. Conversely, if the RSI is in an oversold condition (below 30), it may indicate that the price has declined too much and a potential reversal or bounce may occur.
- Moving Averages: Moving averages are widely used trend-following indicators that smooth out price data over a specific period. Traders may utilize moving averages, such as the 50-day or 200-day moving average, to identify the overall trend and confirm the breakout from the ascending triangle pattern. If the price is trading above the moving average, it may indicate a bullish bias. Additionally, the crossing of different moving averages, such as the golden cross (50-day moving average crossing above the 200-day moving average), can further strengthen the bullish signal.
- Volume Oscillators: Volume oscillators, such as the Volume Weighted Average Price (VWAP) or On-Balance-Volume (OBV), can provide insights into the strength of buying or selling pressure during the breakout. Traders may look for confirmation of the breakout by observing increasing volume alongside the price move. If the volume is significantly higher than average, it suggests strong market participation and validates the ascending triangle breakout.
- Fibonacci Retracement: Fibonacci retracement levels are derived from the Fibonacci sequence and can help identify potential support and resistance levels. Traders may use Fibonacci retracement levels to determine possible price targets or areas of price consolidation after a breakout from the ascending triangle pattern. Common retracement levels include 38.2%, 50%, and 61.8%, which are often used to gauge potential pullback levels before the upward trend resumes.
- Bollinger Bands: Bollinger Bands consist of a moving average, usually the 20-day simple moving average, and two standard deviation bands above and below the moving average. They help measure volatility and identify potential overbought or oversold conditions. Traders may use Bollinger Bands to assess the potential strength of the breakout from the ascending triangle pattern. If the price breaks out above the upper band, it may suggest that the upward momentum is strong, while a break below the lower band may indicate a potential reversal.
Conclusion
The ascending triangle pattern is a valuable tool for technical traders to identify potential bullish breakouts. By understanding the characteristics of this pattern and combining it with other technical analysis tools, traders can make informed decisions and improve their chances of success in the market.
The technical analysis patterns, including the ascending triangle, are not foolproof and should be used in conjunction with other forms of analysis. Demand and Supply theory is the perfect solution for technical analysts. It’s important to consider market conditions, overall trends, and other factors that may impact the price movement.
By understanding the nuances of the ascending triangle pattern and incorporating it into a comprehensive trading strategy, traders can potentially capitalize on bullish breakouts and improve their trading decisions.
FAQ
How accurate are ascending triangle patterns?
The accuracy of ascending triangle patterns, like any other technical analysis pattern, is not 100% guaranteed. While ascending triangles can indicate potential bullish breakouts, it’s crucial to consider other factors such as overall market conditions, volume, and fundamental analysis. Traders often use ascending triangles in conjunction with other technical indicators to increase the probability of successful trades.
How do you calculate the target price following a breakout from an ascending triangle pattern?
To calculate the target price following a breakout from an ascending triangle pattern, traders typically use a measured move technique. The measured move is calculated by taking the height of the triangle and adding it to the breakout point. This projected distance provides an estimated target for the upward move. However, it’s important to note that the target price is not guaranteed, and other factors can influence the price action.
CATEGORIES


 Facebook
  Instagram
  Youtube
