What Is a Wedge Pattern? A Simple Look at Falling and Rising Wedges


Trading world comes up with all sorts of chart patterns, helping traders decode the market moves and sharp turns. Most patterns are good at one or the other, but there are only a few that tells about both continuation and reversals.
Among those is Wedge Patterns which can not only confirm when the current trend is getting stronger but also can give you a heads-up that a trend might be about to flip. If you know how to spot these wedge patterns, you can get a pretty good idea of what the market might do next, whether it’s about to change lanes or just keep cruising.
In this blog, we’ll explore what is wedge patterns, breaking down what they are, the differences between Falling and Rising Wedges, and how you can spot them on a chart.
What is Wedge Pattern?

A Wedge Pattern shows up on a chart when the price starts moving within a tighter range, slowly narrowing down. If you draw trendlines along the highs and lows, and those lines start to come together, you spot a potential a wedge pattern.
The most fascinating trait of patterns is, unlike most technical chart patterns, which goes one way – either representing continuation or reversal of trend, it carries the possibility of both potential outcome. Hence, wedge can be either falling or rising. Not only this, wedge can also be angled – tilt in the direction of the trend. This means when prices are trending up or down, and the swings within the wedge get smaller.
Wedges can give you clues about what might happen next. Sometimes, the price breaks out of the wedge and keeps going in the same direction as before. Other times, it might break out and turn things around, starting a new trend in the opposite direction. This suspense makes it thrilling yet exciting for investors. Let’s find a way to sneak into it’s secrets to unravel the suspense.
Types of Wedge Patterns

Although all wedge patterns carry the same characteristics, there are mainly two types of Wedge – rising and falling patterns. Let’s take a deeper look into these types:
Rising Wedge Patterns
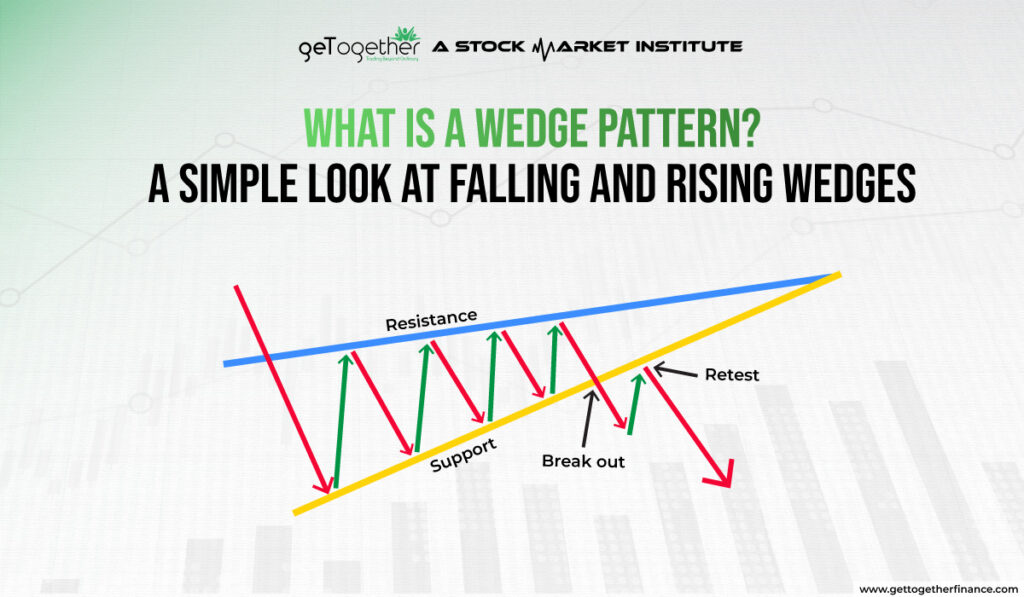
Also known as ascending wedge pattern, a rising wedge happens when the price keeps hitting higher highs, but each swing up gets smaller. In this, even though the price is going up, the fact that the swings are getting smaller shows that the upward push is losing steam. Let’s break down the information for a better understanding:
How It Forms
Just like other patterns such as head and shoulders or flags, rising wedges or ascending wedge pattern often lead to a breakout. But with in this formation, the breakout usually means the price will go down, not up.
When It Appears
- In an Uptrend: If the market has been going up, a rising wedge shows that traders might be starting to doubt the upward trend. The price keeps hitting higher highs and higher lows, but the moves get smaller each time.
- In a Downtrend: If the market is already falling, a rising wedge can be a brief pause before the downtrend continues.
What It Means
At first, a rising wedge might look like the market is still going up because each peak and trough is higher than the last. However, the key thing to notice is that these upward moves are getting shorter. This suggests that the buying strength is weakening and sellers might be gaining control.
Also Read: Ascending Triangle Pattern
Falling Wedge Patterns
Also known as descending wedge pattern, a falling wedge is a chart pattern that looks like a triangle pointing downwards. It forms when the price of a stock or asset makes multiple dips to new low points, but each dip is smaller than the previous one. This creates a downward trend where the price waves are getting closer together, or converging. Let’s breakdown it’s key aspects into smaller pieces:
How It Forms
A falling wedge is the opposite of a rising or ascending wedge pattern. It often leads to a breakout, but unlike rising wedges which lead to price drops, falling or descending wedge patterns usually lead to price increases.
When It Appears
- In an Uptrend: If the market has been going up, a falling wedge shows a short-term pause before the price continues its upward trend.
- In a Downtrend: If the market has been falling, a falling wedge indicates that traders might be starting to question the downward trend.
What It Means
At first, a falling wedge might seem like a continuation of a downtrend since each dip and peak is lower than the last. However, the crucial detail is that these downward moves are getting shorter. This suggests that buyers might be getting ready to take control and push the price up.
Difference Between Rising Wedge Pattern & Falling Wedge Pattern

The key difference between the Rising Wedge Pattern and the Falling Wedge Pattern lies in their formation and the implications for future price movements.
Here is a simplified version to differentiate the key points of both ascending and descending wedges:
| Feature | Rising Wedge Pattern | Falling Wedge Pattern |
| Formation | Made by two lines going up. | Made by two lines going down. |
| Price Movement | Prices make higher highs and higher lows. | Prices make lower highs and lower lows. |
| Market Trend | Suggests a possible downward turn. | Suggests a possible upward turn. |
| Breakout Direction | Usually breaks down. | Usually breaks up. |
| Market Context | Often appears after an upward trend. | Often appears after a downward trend. |
| Trading Implication | Traders may want to sell or short. | Traders may want to buy or go long. |
Trading With A Wedge Pattern

When trading with a wedge pattern, using demand and supply zones can help you identify the best entry and exit points. Here’s how you can approach it:
Identify the Wedge Pattern
First, spot the wedge pattern on your chart—whether it’s a Rising Wedge or a Falling Wedge.
Plan Your Entry
- In a Rising Wedge, consider entering a short position below the proximal line (the lower trendline of the wedge) once the price breaks downward.
- In a Falling Wedge, look to enter a long position above the proximal line (the upper trendline of the wedge) when the price breaks upward.
Set Your Exit
- For a short trade in a Rising Wedge, plan to exit before the price reaches the distal line (the upper trendline of the wedge) to secure your profits before the price hits potential resistance.
- For a long trade in a Falling Wedge, aim to exit before the price reaches the distal line (the lower trendline of the wedge) to avoid a possible reversal at this level.
Monitor Volume
Pay attention to volume as the price breaks out. Higher volume can confirm the breakout’s strength, giving you more confidence in your trade.
Risk Management

Since technical analysis chart pattern has evidently left traders hanging with the wrong idea, it is highly recommend to follow due diligence and club it with foolproof theories such as demand-supply dynamics. You can easily learn this pattern from its first 10-session course available on YouTube for free.
Once you are ready with fundamental, here is how you can trade wedge patterns using demand-supply dynamics:
Locate the Demand and Supply Zones
- For a Rising Wedge, look for the supply zone above the wedge where sellers are likely to step in.
- For a Falling Wedge, find the demand zone below the wedge where buyers are expected to enter.
Make Stop-Loss A Staple
Always use stop-loss orders to manage your risk. In a Rising Wedge, place your stop-loss just above the distal line, and in a Falling Wedge, set it just below the distal line. This will save your money in case of fakeouts.
By aligning your entry and exit points using demand and supply dynamics, you can trade wedge patterns more effectively and improve your chances of making profitable trades.
Conclusion
In a nutshell, wedge patterns can be a useful tool for predicting price movements, showing whether a trend might continue or reverse. They are helpful for spotting potential changes in the market direction. However, to make better trading decisions, it’s a good idea to use wedge patterns alongside other reliable methods, like understanding demand and supply dynamics. By combining these tools, you’ll have a clearer view of the market and be better prepared to make informed trades.
FAQs
How do you spot a Falling Wedge?
Start with spotting two downward-sloping trendlines that converge, with the lower trendline falling slower than the upper one.
How long does a wedge pattern last?
A wedge pattern can last from a few weeks to several months. Although the duration of wedge is completely baser upon what time frame it appears.
What is the flagpole in a wedge pattern?
The flagpole is the initial strong price movement that occurs before the wedge forms.
Can wedge patterns be used in any market?
Yes, wedge patterns can be used in stocks, forex, commodities, and other financial markets.


 Facebook
  Instagram
  Youtube
