Three Black Crows Pattern: Definition, Formation, and Trading Tips Explained
- September 27, 2024
- 884 Views
- by Arun Singh Tanwar

 Facebook
  Instagram
  Youtube
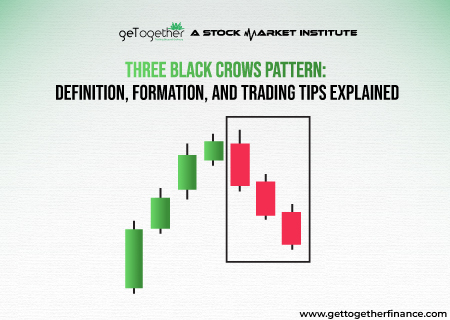
Have you ever looked at a stock chart and noticed a pattern that seemed to scream, “Time to sell!”? This interesting setup is like a warning sign for traders, suggesting that a price drop might be on the way after a rise.
Picture three dark candles lined up in a row, each one closing lower than the last—it’s a clear sign that the bears are taking charge.
In this article, we’ll explore what is the Three Black Crows pattern, how to spot it, and some real-world examples that show it in action. So without any delay, let’s jump right in.
What is Three Black Crow Patterns?

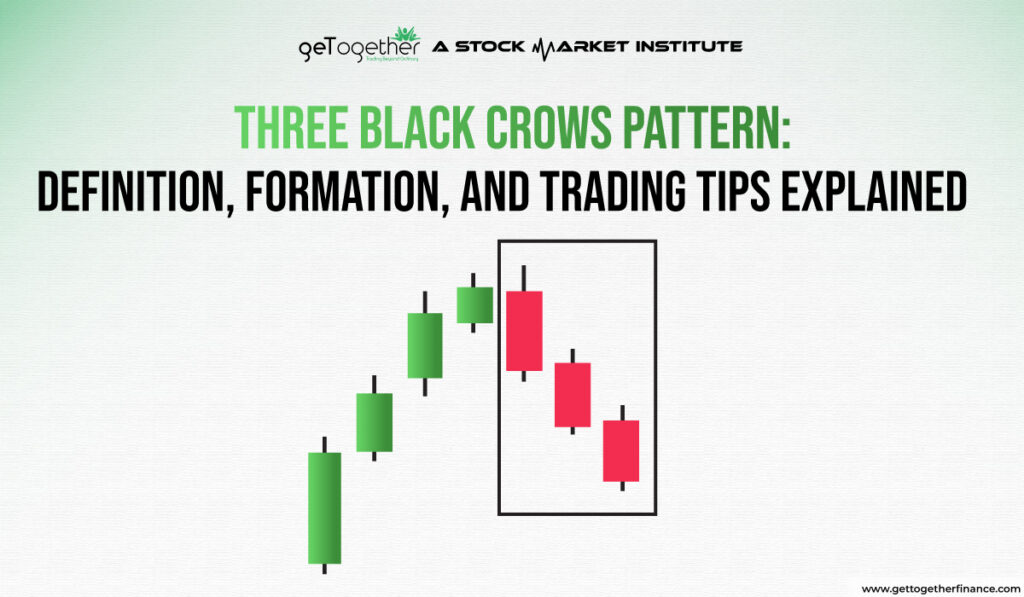
The Black Crow pattern, also known as the Three Crows pattern, is a bearish candlestick setup that hints a downtrend might be kicking in. It’s made up of three long red candles, each opening within the previous one’s body and closing lower. This pattern shows strong selling pressure, dragging prices down for three days straight.
Traders usually don’t rely on this pattern alone—they’ll pair it with other technical indicators or chart patterns to confirm if a reversal is really on the way. Once they spot it, they might think about taking a short position. But, before jumping in, it’s always a good idea to check the volume and other indicators to back up the move.
Let’s see how it works.
Formation of Three Black Crows

Spotting a three Black Crows is pretty easy – all it needs is three red candles on the chart, each one closing lower than the last.
Here is how to spot a three Black crows:
- First Candle: The price goes up but then closes lower.
- Second Candle: The next day, the price opens lower and closes even lower than the first candle.
- Third Candle: On the third day, the price opens lower again and closes even lower.
When traders see this pattern, it suggests that sellers are taking over and that the price might keep falling. It’s a warning sign to be cautious if you’re holding onto a stock that has been going up.
Real-Life Example of Three Black Crows Pattern

Practical examples make a concept more easier to understand. Here’s a real-life example of the Three Black Crows pattern explained:
Name: Reliance Industries
Date: Feb 20-25, 2020
Time Frame: Daily Chart
In Feb 2020, Reliance Industries showed a classic example of the Three Black Crows pattern, indicating a potential reversal in its price trend. After a strong upward movement, the stock formed three consecutive bearish candles over three trading days.
Price Movement
- Feb 20, 2020: The stock opened at ₹1323.70 and closed lower at ₹1313.97. This was the first sign of weakness as the price fell from its previous high.
- Feb 24, 2020: The stock opened at ₹1299.60 and continued to decline, closing at ₹1277.70. This second day confirmed the bearish sentiment as the stock made another lower close.
- Feb 25, 2020: On the third day, the stock opened at ₹1283.40 and closed at ₹1246.80, completing the Three Black Crows pattern. This final candle reinforced the idea that sellers were in control.
How to Trade Three Black Crows Pattern?

Trading the Three Black Crows pattern using demand and supply zones is all about timing your entry and exit to catch the best price movements. Here’s how to do it in simple terms:
Spot the Pattern
First, watch for the Three Black Crows pattern on your chart. This pattern shows up as three long red candles, each closing lower than the one before, indicating that the price is dropping steadily.
Wait for the Price Drop
After the Three Black Crows pattern appears, you’ll see the price drop significantly. This is where you want to consider entering a short trade (betting that the price will continue to fall).
Entry Point
If the price tries to rally back up but struggles to break through, it’s a sign that the downward momentum is still strong. You can enter your trade around this point, aiming to catch the next leg down.
Exit Point
Plan to exit your trade just above the demand zone. This is where the price might bounce back up, so it’s a good idea to lock in your profits before that happens.
By combining the Three Black Crows pattern with demand and supply zones, you can make more informed trading decisions. You’re essentially waiting for a rally to fail at the supply zone before jumping in and riding the price drop down to the demand zone, where you can then exit with a profit.
Also Read: Wedge Pattern
Limitations of Three Black Crows Pattern

The three crows pattern can cause prices to drop, so traders should watch out for oversold conditions that might lead to prices stabilizing before falling further.
Traders should also check other chart patterns or technical indicators to confirm a reversal, instead of solely relying only on the three black crows formation. For example:
How To Trade Three Black Crows Using Demand-Supply Dynamics?

Demand-supply theory is a profound technical analysis method that uses laws if physics and business, considering risk Management and offers a strong trading set-up. You can easily learn it from its YouTube course for free. Once you learn it, here is how you can use it to strengthen your current strategy and Trade Three Black Crows pattern:
Identify the Supply Zone
Before the Three Black Crows pattern forms, there’s usually a rally, where prices go up. The highest point before this pattern starts to form is called the supply zone. This is where sellers are likely to step in again if the price tries to rally.
Target the Demand Zone
As the price continues to drop, keep an eye on the demand zone, which is the area where buyers are likely to step in and push the price back up. This zone is usually located near a previous low on the chart.
Add Stop-Loss
It’s not always true that three Black crows led to a downtrend. Sometimes, it has left traders dry on the expectation on downtrend, only to take a sharp up route. Hence, to manage risk, always use stop-loss just above the proximal line of supply zone. It may cause the lose of money, buy it would be calculated and you can create better strategy with rest amount in your hand.
Clubbing these both technical analysis concepts can make your trading setup strong. You can also equip it with other technical indicators such as moving averages, support and resistance, etc.
Conclusion
The three Black Crows pattern is a useful signal that prices might continue to drop. It shows three strong red candles in a row, which suggests a bearish trend. However, it’s important to remember that this pattern isn’t always reliable. Sometimes, the pattern might signal a drop that doesn’t happen, known as a “fakeout.” Traders should not rely solely on this pattern but should use it alongside other tools and indicators such as demand-supply theory to make better trading decisions. You can easily learn this foolproof method of demand-supply dynamics with its free YouTube sessions to get the gist of concept.
FAQs
Is the three Black Crows pattern always accurate?
No, it’s not foolproof. Sometimes, prices might not drop as expected, hence it’s best to use it with other technical theories or indicators.
Are there any risks with using the three Black Crows pattern?
Yes, it might lead to a “fakeout,” where the price doesn’t drop as expected, so use it carefully.
Can the three Black Crows pattern work in day trading?
It can, but it’s best used with other indicators to make quick decisions.
How often do fakeouts happen with this pattern?
Fakeouts can occur, but their frequency varies based on market conditions and how you use the pattern.