Hanging Man Candlestick Definition and Tactics
- December 5, 2024
- 2492 Views
- by Manaswi Agarwal


In technical analysis, as we all know candlestick patterns play a vital role in deciphering price movements in security. Traders can analyze a bundle of candlestick patterns and still the list would go on. So here with this blog, we will understand the depth of the hanging man candlestick pattern with its significance and importance in the stock market.
What is the Hanging Man Candlestick Pattern?
Hanging Man Candlestick Pattern is a technical chart pattern analyzed through candlesticks that signal a potential reversal in uptrend i.e. Bearish Reversal Pattern. The hanging man pattern develops during an upswing, where the buyers are active and hence make higher highs but after the occurrence of the pattern, traders get the warning of upcoming selling pressure in the security.
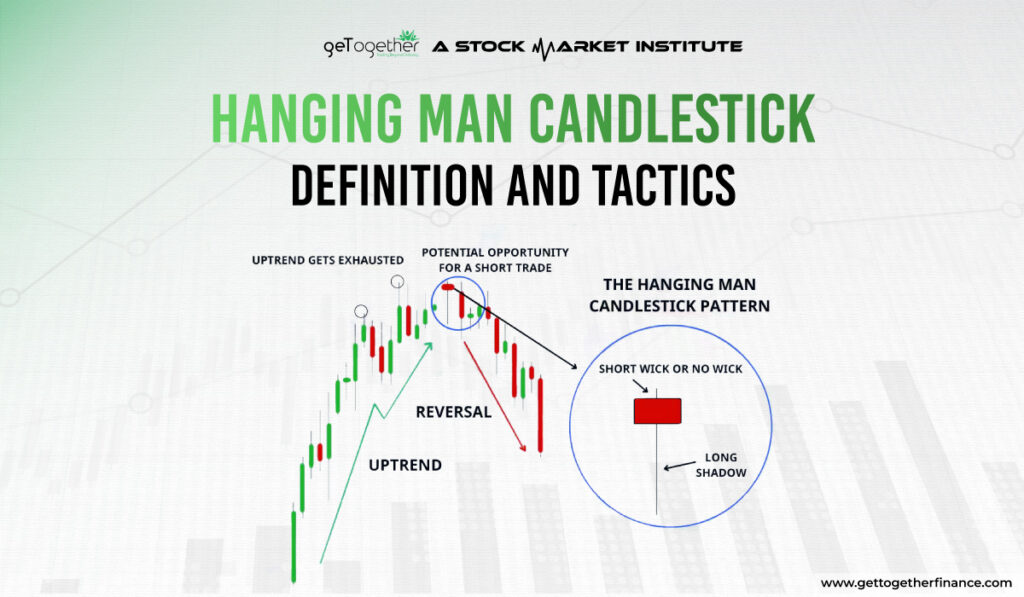
The candlestick resembles a man hanging upside down. It is determined by a small body at the top of the trading range and a long lower shadow. This indicates an increased selling pressure in the security to outweigh the buying momentum.
Hanging man candlestick pattern is a tale of market sentiments that represent the waning of buyers. A base candle after an ongoing uptrend warns buyers as the market becomes cautious or bearish because sellers find an opportunity to push back, testing the strength of the uptrend. This represents a shift of trend from buyers to sellers that also highlights the importance of vigilance in trading.
How to Identify Hanging Man Candlestick Pattern in Technical Analysis?

The Hanging Man pattern on the charts is a strong pattern to predict a reversal in security. Look for an uptrend in the security, when the price forms a small body with a lower long shadow which is twice the body, indicating a minimal price movement during the trading session.
Therefore; non-existent upper shadow, small body, closing near the top, lower long wick are the characteristics to depend on while finding out the hanging man candlestick pattern. However, the pattern is not confirmed until the price falls in the next trading session, the price ought not close above the high of the hanging man candle to continue the bearish move in the next trading session. If the prices fall, the pattern is confirmed which gives traders a signal to manage their position.
Is Hanging Man bullish or bearish?

The hanging man signifies a bearish reversal pattern as it forms after a continued uptrend in security. You can go short in the security when you identify a hanging man upside-down candle on the charts.
Trading with Hanging Man Candlestick Pattern
To trade the hanging man candlestick pattern with efficiency, consider the following:
Identify the Pattern
Look for the formation of uptrend in the security which is followed by the hanging man candle with dangling legs that respects the supply zone.
Confirmation
Receive the confirmation of the pattern when the price continues to fall in the next trading sessions. If buyers are able to sustain in the security breaching the high of hanging man candle, the pattern, the trade gets rejected. So confirm the trend with a potential reversal signal.
Entry or Exit Points
Once the confirmation of the pattern is received, traders exit for the long positions and enter into short positions. The stop loss order for the short position is placed above the high of the hanging man candle to avoid losses if the trade goes in the opposite direction. Be careful and manage your risks through stop loss as it defines an opposite direction of the trade. A proper risk management protects your capital and helps you to sustain the market in negative situations.
Demand and Supply
You can get better results when you trade the hanging man candle pattern associated with the demand and supply approach. When the pattern coincides with the supply zone, the credibility of the pattern increases as it strongly indicates a bearish reversal in the security. A supply zone of the higher time frame is more reliable when associated with this pattern.
Not only this, you can efficiently manage your risks by placing the stop loss order above the supply zone. Hence, demand and supply theory is one viable approach to protect your capital and gain maximum returns with calculated risks.
Difference between Hanging Man and Hammer Pattern

Hanging Man is quite similar to Hammer pattern while often leads to confusion among traders. A hammer pattern emerges in a falling trend which signals a bullish reversal in the security, conversely, the hanging man pattern appears in a rising trend indicating a bearish reversal.
Both of them look similar, but the formation is in a different direction. The prior move or the short-term trend distinguishes these two candlestick patterns.
Benefits of Hanging Man Candlestick Pattern

In technical analysis, hanging man candlestick patterns offer various benefits to the traders as they can trade with appropriate risk management activities.
Early Reversal Signals
The formation of the hanging man pattern suggests a potential reversal in the security quite earlier than the actual reversal starts. The candle strongly represents that buyers are waning which leads sellers to gain control over the security.
Wide Usage
The hanging man pattern can be used in a variety of financial markets that include stocks, forex and commodities. The technical pattern offers versatility to the traders to make successful use of this tool in financial markets.
Entry and Exit Points
There are clear and defined entry and exit points for traders that guide them when to buy and when to sell the asset keeping their risks aside.
Limitations of Hanging Man Candlestick Pattern
Like other technical chart patterns, hanging man candlestick pattern also has various drawbacks that must be carefully looked upon:
False Signal
The pattern might provide false signals sometimes as none of the patterns in technical analysis can be accurate. There are no defined target points which does not allow you to enjoy maximum profits in a chart. To exit at the target, it is preferable to associate with demand and supply theory and enjoy maximum returns.
Dependent on Technical Indicator
Relying solely on hanging man candlestick patterns is not recommended to trade as to increase the efficiency and reliability of trade, they have to take support of other technical indicators so that they can avoid losses.
Demand and Supply with Hanging Man Pattern

As we know, demand and supply is the base concept which drives buying and selling of securities in the market. Trades executed without the support of demand and supply zone can turn out to be a blunder and hence this needs to be avoided. To trade hanging man patterns, you must look for the supply zone with support of higher time frames. You can stay confident when you approach through demand and supply theory as you follow proper risk management techniques with entry, exit and targets.
Conclusion
The hanging man candle which looks like a man upside-down represents a bearish reversal in the security. To know how to trade efficiently through the demand and supply approach, you can watch the free Trading in the Zone course available on YouTube offered by GTF that is far more reliable and efficient.
FAQs
What is the Hanging Man Candlestick Pattern?
A hanging man candlestick pattern is a bearish signal that warns buyers to exit their long positions.
How to recognize Hanging Man Candlestick Pattern?
The hanging man candlestick pattern occurs after an uptrend represented by a candle with a small body and long lower shadow.
Can I use other technical indicators with a hanging man candlestick pattern?
Yes, using other technical analysis indicators increases the credibility of the pattern, on top of it, demand and supply is one of the best to consider.
How accurate is the hanging man pattern?
The accuracy of this pattern depends on a trader’s individual strategy. It is most reliable when using a demand and supply strategy.


 Instagram
