What Is a Pitchfork Indicator? How To Use Andrew’s Pitchfork


Table of Contents
ToggleIntroduction
The world of trading is quite fast-paced and here the pitchfork indicator is one of the technical trading tools that helps traders track the price movements of the stock with precision. Technical indicators like pitchforks act like a trader’s compass in the deserted charts. They help thoroughly in analyzing past price data to provide insights about current price trends and key price levels for reversals. They help in spotting reversal points, support, and resistance levels that are eventually essential in making informed trading decisions.
Andrew’s Pitchfork is a unique type of indicator that has three parallel lines that help in identifying support and resistance points in marked areas. Three key price points are used to draw the parallel lines that help in preceded tracking. With these simple yet powerful lines. This tool has become a favorite for traders who are looking to navigate the market based on support and resistance.
Mastering Andrew’s Pitchfork can be a good add-on to your trading strategy, it can significantly help you tackle even the most unpredictable and adverse market scenarios.
What Is a Pitchfork Indicator?
A pitchfork indicator is a widely used technical tool by conventional traders that helps traders predict future price trends. It is made with three parallel lines that are drawn based on three specific price points. These lines act as the indicators of where the price may find support, resistance, or continue its trend.
Definition and History
The pitchfork indicator was introduced by Dr. Alan Andrews, he is a financial market expert, who developed this indicator to analyze price action and market behavior on candlestick charts. The name of the tool comes from its shape; it resembles a farmer’s pitchfork that has one central line (the “median line”) and two parallel lines on either side.
Key Components of Pitchfork Indicator
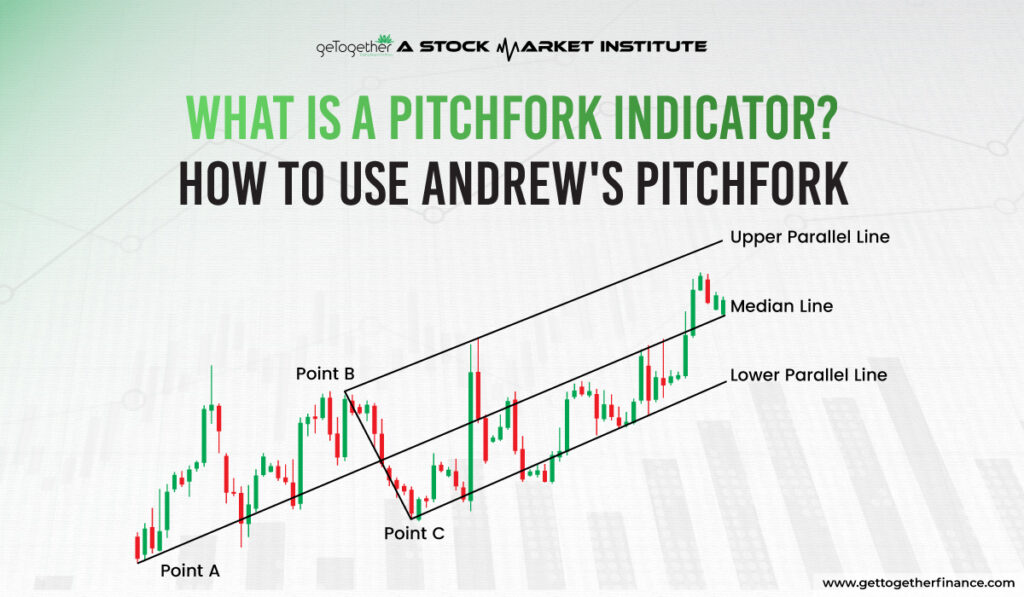
- Median Line: This is the centerline of the pitchfork indicator, it is drawn from the starting point and dragged forward based on the direction of the trend.
- Upper Parallel Line: This line is drawn above the median line, it represents the potential resistance levels that can push the price down.
- Lower Parallel Line: This is drawn just below the median line, it represents the potential support levels that can push the price up.
Importance in Technical Analysis
This indicator is widely used in these things:
- Identifying the direct direction of the price trend
- Give insights into the price levels from the reversal may come
- Provide detailed visuals of support and resistance levels of the price.
These indicators are simple yet effective, which makes it a favorite of many conventional traders aiming to make strategic decisions in the market.
How to Draw Andrew’s Pitchfork

Andrew’s Pitchfork is drawn using three important price points creating a set of parallel lines that helps traders in analyzing the trend of the price. Here’s a simple step-by-step to draw Andrew’s Pitchfork:
1. Selecting Pivot Points: A, B, and C
Initially, you need to find three crucial price points in the chart:
- Point A: This is the starting point of the indicator, it is typically a high or low where a trend begins.
- Point B: The second that you need to consider is marking a significant peak or trough made after Point A.
- Point C: At last, the third point is another high or low made by the price after point B.
These points altogether are said to be turning points in the price movement and are used to construct the pitchfork’s structure.
2. Drawing the Median Line
The median line is said to be the backbone of the pitchfork indicator. It is drawn by connecting Point A to the midpoint between Points B and C. This acts as the central line, which in turn acts as a guide for the trend, showing the direction towards which the price is likely to trade.
3. Creating the Parallel Channels
After you’ve drawn the median line:
- It is the line parallel to the median drawn through Point B, it is called the upper channel.
- Next, another line parallel to the median is drawn through Point C, it is called the lower channel.
These channels all together help in creating a visual roadmap of the price movement of the stock and highlight the potential areas of support (lower channel works as support area) and resistance (upper channel works as resistance area).
By following this step-by-step guide, you can easily construct or draw Andrew’s Pitchfork on a candlestick chart you are analyzing and use it to predict future price movements that stock can follow within the defined channels.
How Andrew’s Pitchfork Indicator Works

Andrew’s Pitchfork helps traders analyze price movements by creating a structure that highlights the potential support and resistance levels, breakout zones, and erection of the trend. Here’s how it works:
1. The Concept of Market Equilibrium
The main purpose of Andrew Pitchfork is the market equilibrium—it is a balance point in the chart where the price usually moves or consolidates within a range. The media online we studied above acts as this balance line, it shows the average direction of the trend. Price is often seen moving in the direction of this line, amidst the imbalance of demand and supply.
2. Interpretation of Price Movements Within the Pitchfork
When the price consolidates within the range of pitchfork indicators’ three lines: (median, upper, and lower):
- When the price is above the medium line, it indicates buying strength or an uptrend.
- When the price is below the median line, it indicates selling strength or a downtrend.
- When the price moves back and forth between the upper and lower lines, staying within the channels, it indicates a stable or sideways trend.
This knowledge significantly helps traders understand whether the market is trending or consolidating.
3. Identifying Support, Resistance, and Breakout Zones
- Support: The lower parallel line, made from point C is said to be the line of support, the price is likely to get support from here and bounce up.
- Resistance: The upper parallel line, made from point B is said to be a line of resistance, the price is likely to resist here from going up.
- Breakout Zones: If the price consolidates between the upper or lower lines, it signals a possible breakout, indicating a strong shift in the trend in the upcoming time.
By observing moving between these lines, conventional traders make decisions about entering or exiting trades and managing risk effectively.
Advantages and Limitations of Andrew’s Pitchfork

| Advantages | Limitations |
| Simple and Visual: Easy to understand and use, even for beginners. | Subjectivity in Selecting Points: Incorrect pivot points can lead to errors. |
| Identifies Key Levels: Highlights support and resistance zones for better trade planning. | Limited Use in Ranging Markets: Not effective in sideways or non-trending markets. |
| Tracks Trends: Provides a framework to identify and follow market trends. | Prone to Breakouts: Unexpected price movements can lead to false signals. |
| Dynamic Analysis: Adjusts to price changes, making it versatile across different conditions. | Requires Confirmation: Needs to be paired with other indicators for reliable signals. |
| Works Across Markets: Applicable to various asset classes and timeframes. | Steep Learning Curve: Mastery requires experience and consistent practice. |
Is Pitchfork Indicator Really Useful?

The pitchfork indicator is one of the handy tools for conventional traders. But in current times, its impact has reduced due to wide usage, just like the other conventional tools, we do not recommend using anything apart from demand and supply theory. You can use the pitchfork indicator as an add-on to your study of demand and supply, but solely relying on pitchfork can be risky. If everything in your trade setup aligns and Pitchfork is also showing the trend favorable to your trade, then it is an extra trade score.
Conclusion
Andrew’s Pitchfork is an effective but simple tool for traders to analyze price patterns, support, and resistance levels. By providing a clear visual framework, it enables traders to navigate market movements and make informed judgments. However, like any tool, it has limitations. The usefulness of the pitchfork is dependent on the right selection of pivot points and its application in moving markets.
While it can help your trading approach, it should be combined with other tools such as demand and supply research for greater accuracy. Remember that no single indicator assures success. By practicing and understanding its subtleties, Andrew’s Pitchfork can help you control risk and seize chances in your trading.
Frequently Asked Questions
What is the purpose of Andrew’s Pitchfork in trading?
Andrew’s Pitchfork enables traders to discover probable support and resistance levels, forecast price trends, and watch market movements. It provides a structured framework for analyzing price behavior around three critical pivot points.
Can the pitchfork indicator be used for all types of markets?
Yes, the pitchfork indicator is adaptable and can be used in a variety of financial markets, including stocks, FX, and commodities. However, it performs best in trending markets and may be less effective during sideways price moves.
How do I select the pivot points (A, B, C) for drawing the pitchfork?
Pivot points are major highs or lows on a price chart. Point A represents the trend’s start point, while Points B and C are subsequent peaks or troughs that define the pitchfork’s structure.
Can the pitchfork indicator be used alone for trading decisions?
While the pitchfork indicator is effective, it should be used in conjunction with other techniques, such as demand and supply analysis or moving averages, to validate trends and decrease the possibility of false signals.
Is Andrew’s Pitchfork suitable for beginner traders?
Yes, its basic design makes it ideal for beginners. However, beginners should practice recognizing pivot points and evaluating price movements before depending heavily on them in live trading.


 Instagram
