Fractal Indicator: Definition, What It Signals, and How to Trade
- January 7, 2025
- 1963 Views
- by Manaswi Agarwal

 Instagram
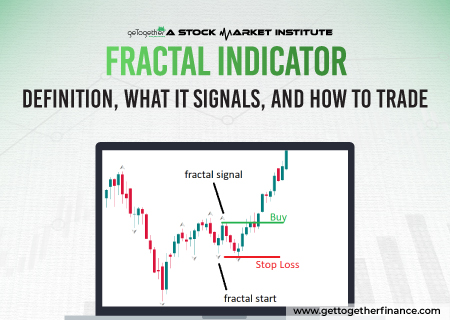
Traders can identify potential trend reversal in the securities market through a fractal indicator which is a strong mathematical concept. Fractal indicator was introduced by Bill Williams to analyze and predict the trend reversal or turning points in price movements.
What are Fractal Indicators?
Fractal indicators are trading tools that make identification of key turning points in the security easier. It is a simple price recurring geometric pattern which is repeated in the charts on different time frames. The two types of fractals include: bearish and bullish fractal. The patterns are also known as “up fractals” and “down fractals”. The middle bar in fractal creates the highest high or the lowest low as compared to the other two bars on either side.
Five Candlesticks: The five candlesticks altogether creates a fractal pattern in the shape “U” or “V” to represent the bullish fractal reversal while in the case of bearish fractal, the shape would be reversed “U” or “V”.
Middle Bar: When the middle bar forms the lowest low, it represents a potential bullish reversal in the security. To the opposite of this, when the highest high is formed, it indicates a bearish reversal in the prices of the assets.
How to interpret the Fractal Pattern?

The pattern is clearly seen as it forms a symmetrical shape revealing a “U” shape or “V” shaped pattern. When such a pattern is formed, it indicates a market reversal as it turns the market into a different direction. The formation of fractal patterns is viewed with technical support and resistance indicators.
To interpret the fractal pattern correctly, you must consider the daily pivot points, as well as evaluate the probability with potential signals of a trend reversal with the formation of a fractal indicator.
The formation of a fractal pattern must be confirmed with the closing of the fifth candlestick in the pattern. Traders can only analyze the future price movements after the completion of the fifth candle that justifies the pattern formation. Taking actions before that might get unfavorable results and hence traders may end up making losses.
The premises of fractal patterns in the financial market is that the charts repeat their formation at each time frame.
Bearish Fractal Pattern

As the name suggests, a bearish fractal represents downwards movement in the security. The preceding candles form higher highs which are then followed by the two lower highs than the highs of previous candle which marks the occurrence of bearish fractal formation.
Bullish Fractal Pattern

During the formation of bullish fractal pattern, the candlesticks preceding the lowest low point shows price moving to a lower low which is followed by the two candles forming higher lows than the lows of preceding candlesticks.
Advantages of Fractal Indicators

Now here is a question, why should a trader use a fractal indicator? How can fractal indicators be helpful? Let us know about the various advantages offered by using the fractal indicators:
Easy Identification
The fractal indicator pattern can be easily identified by traders who are regularly involved in the stock market. Traders can easily recognize the entry points and the stop loss orders to perfectly place their trade.
Multiple Timeframes
Traders can make use of fractal indicators on various time frames to predict the future price movements in the security. The indicators can be effectively used on daily, weekly, monthly and even on smaller time frames.
Limitations of Fractal Indicator

Trading with fractal indicators can be very risky and the traders must be very well aware about the false signals that it can provide. Fractal indicators must be used cautiously to gain maximum benefits. Let us know the limitations of using fractal indicators in a trade.
Frequent Formation
The fractal indicator pattern occurs quite frequently and is prone to give false signals to the traders. Rarely any trader executes their trades based on a fractal indicator as they cannot completely rely on this pattern because it is formed rarely that eventually would end up giving limited number of opportunities to the traders.
High Buying
Trading fractal pattern has a disadvantage as traders tend to get the entry above the ideal market entry points. It leads to buying at a higher price than the actual buying leading traders to buy at higher prices. Furthermore, the distance between the stop loss and entry point becomes large which leads to huge losses in case the trade follows the opposite direction as predicted.
Lack Reliability
Trading on fractal indicators is not completely reliable as traders do not have appropriate guidance about where to enter and exit the trade. It is not reliable because in this traders are not aware about the demand in a security, trading based on a demand and supply approach is much more reliable and considerable.
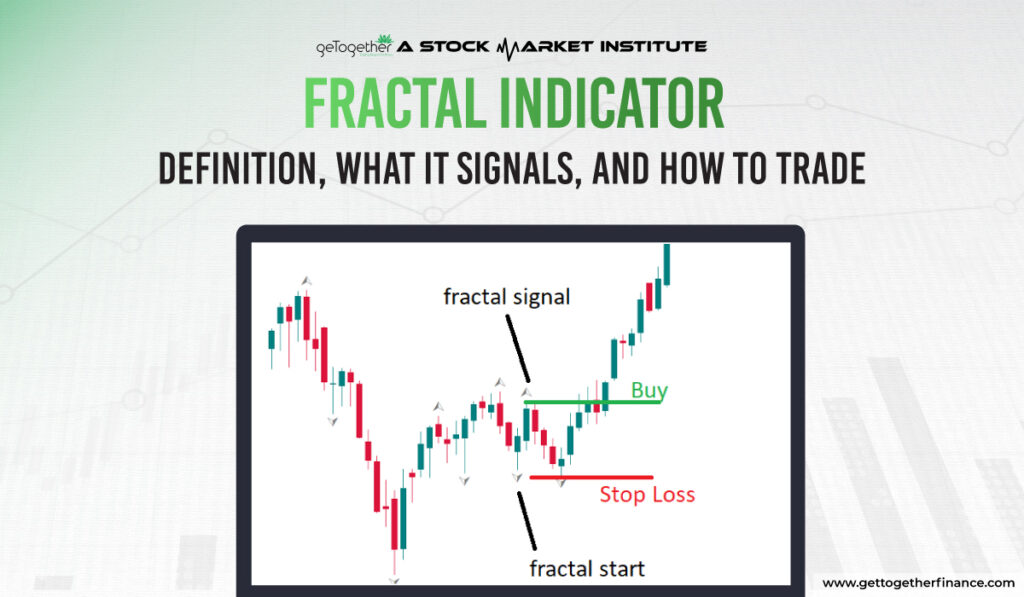
How to Trade Using the Fractal Indicator

You can use the fractal indicator to trade the breakouts. Always combine the fractals with the trend and try to avoid trading in choppy markets.
Trading Bullish Fractal: Enter a long position when the price breaks above the most recent bullish fractal.
Place a stop-loss slightly below the last bullish fractal. Book the profits at the next resistance level or using a risk-reward ratio.
Trading Bearish Fractal: Enter a short position when the price breaks below the most recent bearish fractal.
Place a stop-loss slightly above the last bearish fractal. Take profit at the next support level.
The End Line
As we have understood about how fractal indicators work and their easy identification on multiple time frames is convincing to trade based on this pattern. However, traders must apply demand and supply theory which offers reliability in trading. Trading in the Zone course offered by GTF is an advanced technical analysis course fulfilling stock market education needs of individuals.
FAQs
What is a Fractal Indicator?
Fractal indicator is a mathematical tool which is often used by traders to identify the potential turning points or trend reversal in the prices of security.
What is a bearish fractal?
The formation of bearish fractal signals the traders about a downward movement in the security as the middle candlestick bar forms the highest high.
What is a Bullish Fractal?
Bullish fractal formation is represented by the middle candle among the five candlesticks, the middle candle forms the lowest representing an upward move in the security which signifies the bullish fractal.
What Do Bullish and Bearish Fractals Indicate?
Bullish fractal suggests a potential reversal to the upside while bearish suggests a reversal to the downside.
Are Fractals Reliable in All Markets?
Fractals can generate false signals in choppy markets. They are more reliable in trending markets when combined with other indicators for confirmation.
Can I Use Fractals for Day Trading?
Yes, fractals can be used for day trading on lower time frames, but it’s essential to confirm signals with other technical tools.