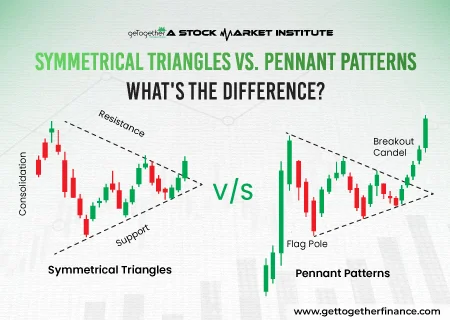
Symmetrical Triangles vs Pennant Patterns: What’s the Difference?


Table of Contents
ToggleIntroduction
In technical analysis, conventional traders use various patterns to navigate the market.
One of the popular convention patterns, the symmetrical triangles and pennant patterns, are kind of similar, but yet have different characteristics and both are used to know the price trends of the stock. If a trader knows the difference between both patterns, they can make informed trading decisions.
Simply a symmetrical triangle is formed when the price consolidates up and down between two converging lines that finally meet at one point which we call the breakout point. On the other hand, a pennant pattern is a small triangular-shaped pattern formed. After a strong trend, it can be either a downtrend or an uptrend. It signals a break in the trend before the price continues to move in the previous direction again.
Conventional traders consider these patterns important because it helps them understand market sentiments and direction. By knowing and understanding the difference between both patterns, traders can easily avoid trading false, breakout, and misinterpretation of some signals. This eventually will help them master their trading strategy..
What is a Symmetrical Triangle?

Let’s first understand what a symmetrical triangle looks like and what is it used for.
Definition and Characteristics
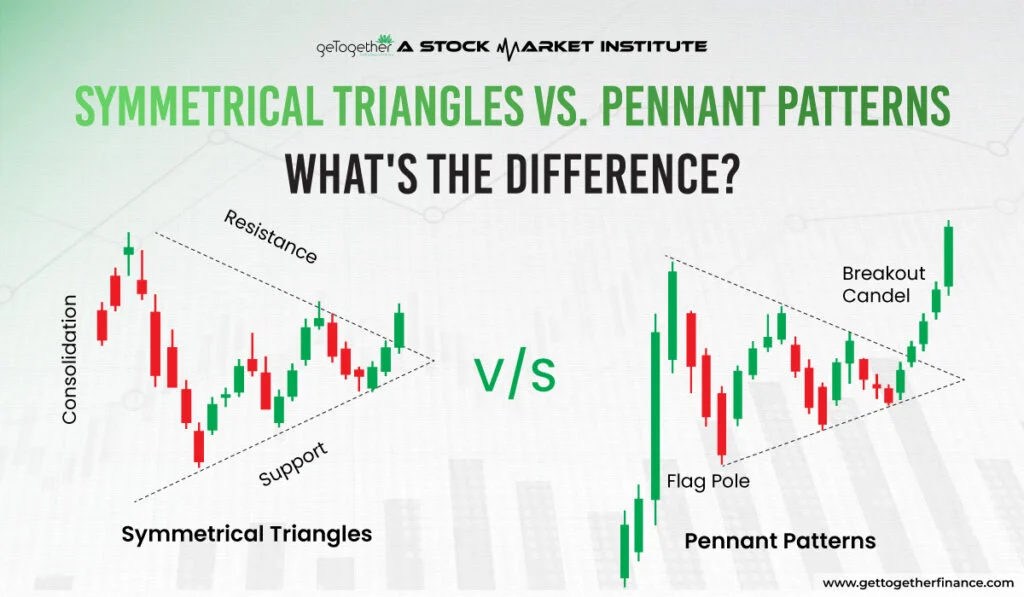
A symmetrical triangle is one of the prominent patterns that can be seen in candlestick charts. It is a pattern where the price of stocks moves between two converging lines. The upper trendline is directed downwards and the lower trendline line directed upwards. When the price reaches the point where converging lines meet, traders often, interpret it as a breakout point.
Usually, this pattern is formed when the market is in a consolidation phase. This is because the price is not able to break a certain range. This is the result of buyers and sellers having close fights.
After the prize reaches the breakout point or converging point, the price usually goes in the direction from where it broke out of the triangle.
Bullish and Bearish Scenarios
- Bullish Scenario: if the price breaks out from the upper trend line, it is known as a bull rally.
- Bearish Scenario: if the price breaks out from the lower trend line, it is known as a bear rally.
This brings us to the understanding that symmetrical triangles come under the neutral pattern, so their future move cannot be predicted until the breakout happens.
What is a Pennant Pattern?

Definition and Characteristics
A pennant pattern is a small symmetrical triangle that forms after a strong move in the market or stock. It sometimes looks like the flag on a pole, but it is much smaller and pointed too. It is usually created when the price consolidates for a brief period, with highs and lows converging and moving close.
How Pennant Pattern Differs from Flags
A pendant differs from a flag chart pattern very closely, the flag is formed at a more steep angle and is usually larger in size. As per the size, flags represent a longer time of consolidation, while pennants are made in a much smaller time. Though both pennants and flags indicate a potential continuation of the existing trend, pennants are seen as a temporary pause, while flags often indicate a longer pause. On the other hand flag patterns may appear the same, but in a flag, parallel trend lines are made, whereas in a pennant, converging trend lines are made.
Typical Occurrence and Market Sentiment
A pennant pattern is formed after a strong move either on the downside or upside, suggesting the market is taking a short break before continuing the trend. This pattern usually signals that the previous trend will resume once the price breaks out of the trend. The market sentiment is hesitant during the formation of the pennant pattern, but it often loosens up with strong momentum in the breakout direction.
Key Differences Between Symmetrical Triangles vs Pennant Patterns

| Aspect | Symmetrical Triangle | Pennant Pattern |
| Shape | A large, symmetrical triangle with converging trendlines | A small, narrow triangle, resembling a flag-shape |
| Formation Duration | Forms over a longer period, indicating extended consolidation | Forms quickly, usually within a few weeks after a sharp price move |
| Size | Larger in size compared to pennants | Smaller and tighter compared to symmetrical triangles |
| Volume | Volume typically decreases as the triangle narrows | Volume decreases during the consolidation, then spikes at the breakout |
| Trend Indication | Can break in either direction (neutral until breakout) | Usually follows a strong price move and continues in the same direction |
| Pattern Location | Can appear after a trend or during a pause | Occurs after a sharp price move, often seen as a brief consolidation |
| Breakout Direction | Breakout can be in any direction, depending on the prior trend | Breakout is expected in the direction of the previous trend (up or down) |
Trading Strategies for Symmetrical Triangles

Entry and Exit Points
- Entry Point: The best time to enter the trade based on symmetrical triangles is when the price breaks out of the trendlines of symmetrical triangles. A bullish breakout is considered when the price breaks from the upper trend line. On the contrary, the bearish breakout is considered when the price breaks from the lower trendline. You can enter long and short positions respectively.
- Target Point: Here, the exit from the trade is based on the type of move that comes after the breakout. The target is then based on the height of the triangle. In the bullish breakout, the place target above the breakout point is equal to the height of the triangle. On the other hand, in the bearish breakout, place the target below the breakout point equal to the height of the triangle.
Risk Management and Stop-Loss Placement
- Stop-Loss Placement: To not fall into the trap of false breakouts, place an intact stop loss just below the breakout point in the opposite direction. Let’s understand with an example. If you are entering a long position or bullish breakout trade, then you have to put your stop loss just below the lower trend line and vice versa in scenarios when you are taking a short trade or breakout trade.
- Risk Management: it is important for traders to use an appropriate risk-reward ratio in every trade. A good strategy will allow a trade to risk only a small amount of its capital. Typically, traders can start from a 1:2 risk-to-reward ratio.
Trading Strategies for Pennant Patterns

Recognizing Breakout Potential
- Identifying the Breakout:
- A pennant pattern is formed when the price is strong, moves, and then takes a pause to consolidate for some time. Traders look for an increase in volume after the consolidation phase to predict that a breakout is now about to come.
- Timing the Trade: after the breakout comes in whichever direction it comes straight again, take positions accordingly in the direction.
Optimizing Risk-Reward Ratios
- Setting Targets: to target measure the range that price traveled in the strong move before the consolidation phase, the same rain should be put as a target after the breakout comes
- Stop-Loss Placement: Place the stop loss intact just outside the pennant pattern on the opposite side of the breakout. This will keep you safe in case of your false breakout.
- Risk-Reward Ratio: In every trade, it’s important to use an appropriate risk-to-reward ratio. A good strategy will allow you to risk only a fraction balance of your trading account. A typical ratio to aim for is 2:1, meaning you expect to make twice as much profit as you are risking on the trade.
Remember this: These patterns are never fulfilling enough for a successful trading career. You need to have a piece of full-fledged knowledge about technical analysis and its dynamic nature to be a profitable trader. We only suggest you stick by your demand and supply theory and if any good pattern aligns with the setup found with the help of demand and supply, then it’s an extra trade score. These patterns should always be used as add-ons, not as a complete strategy.
Conclusion
Symmetrical triangles and pennant patterns are valuable tools for technical analysts because they provide insight into market trends and potential breakout possibilities. While symmetrical triangles represent uncertainty and can break in either way, pennants frequently predict the continuation of a strong preceding trend. Recognising their various properties, including shape, size, formation time, and breakout direction, allows traders to make more informed decisions while lowering the chance of false signals. However, these patterns should not be used only for trading choices. Instead, include them into a larger plan that incorporates extensive technical research and a solid understanding of market dynamics. Combining these patterns with demand and supply zones can improve the accuracy of your trades and help you become a successful trader.
Frequently Asked Questions
What is the key difference between a symmetrical triangle and a pennant pattern?
A symmetrical triangle emerges during long-term consolidation with converging trendlines, but a pennant pattern is a smaller triangle created after a rapid price move, indicating a brief stop before continuing the trend.
Can symmetrical triangles predict the direction of a breakout?
No, symmetrical triangles are neutral patterns, which means the breakout direction is determined by the past trend and market momentum.
How long does it take for a pennant pattern to form?
Pennants are short-term patterns that usually appear within a few weeks, as opposed to symmetrical triangles, which take longer to develop.
What role does volume play in identifying these patterns?
Volume often declines during consolidation and jumps following breakouts, indicating price action.
Are these patterns enough to ensure profitable trades?
No, these patterns, while important, should be used in conjunction with other tools like as demand and supply research, risk management, and stop-loss strategies to improve trading accuracy.


 Instagram
