How Do I Target a Breakout in a Technical Chart?
- March 1, 2025
- 991 Views
- by Suhani

 Instagram
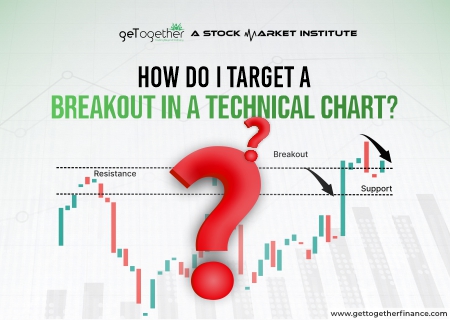
Introduction
In the realm of technical analysis, a breakout in the technical chart is taken as the green signal by traders, who are looking for opportunities to enter in trade. Identifying and acting upon a reliable breakout scenario is one of the important parts of a trader’s learning. The charts are full of false and real breakouts, the trader who knows which one is the real breakout and which is the false, is the one that rides the wave of profits.
This blog dives deep into the art and science of breakouts in technical charts helping with the strategies and tools that are needed to capitalize on breakout market movements. No matter whether you are an experienced trader or a novice trader, mastering the knowledge of breakout will always help you scale in your trading career.
Understanding Breakouts
Breakouts are one of the crucial and most studied concepts of technical analysis. Traders use it to spot potential opportunities in the market.
What is a Breakout?
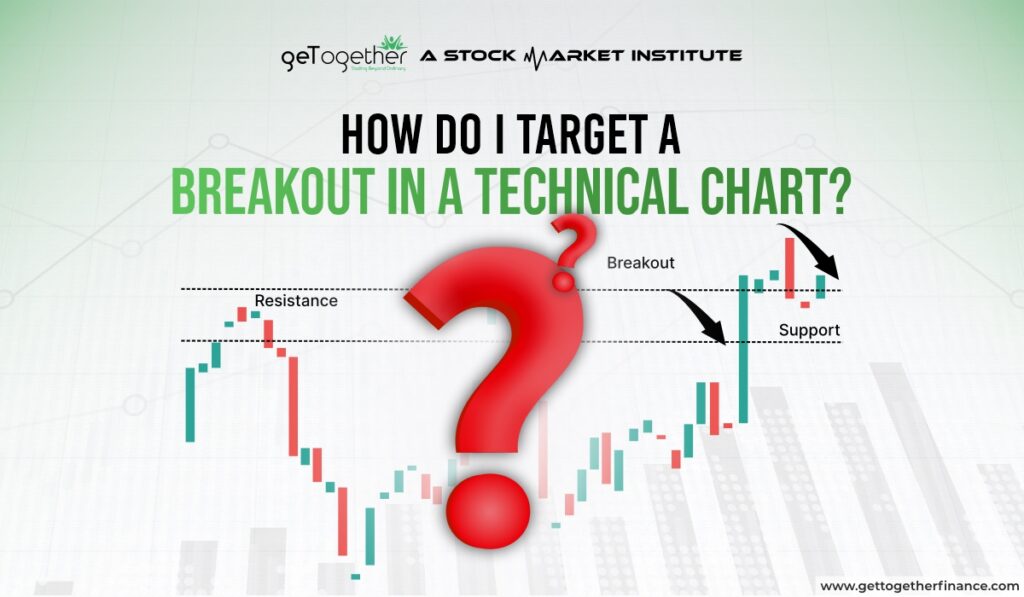
A breakout in the price of a stock happens when the price of the stock moves beyond a specific level or range. It can either be above the range or below the range. This happens when a price is continuously consolidating between a range, if the price breaks it from either side, it is anticipated that the price will continue to trend on that side only. Traders use this as an opportunity to trade the momentum the price is currently in.
The reason why it is anticipated that the price will give a good move is because when the price is traveling in a range means buyers and sellers are equally powerful and fighting to drive the price in either direction and when the range breaks that means either buyer came out more powerful or sellers which will drive price in their direction hence a good move can be expected.
Arun sir used the line as a reference in trading in the zone while teaching about breakouts that
“ Price jitna jyada sangharsh karegi baadme , utnihi jyada acchi move degi”
Types of Breakouts
There are two core types of breakout
- Bullish Breakout:
- This breakout occurs when the price breaks the pattern, range, resistance levels, or specific prices on the upside.
- It often happens when the volume in buying suddenly increases, signaling an upcoming uptrend.
- Bearish Breakout:
- This breakout occurs when the price breaks the pattern, range, support levels, or specific prices on the downside.
- It often happens when the volume in selling suddenly increases, signaling an upcoming downtrend.
Key Price Levels: Support, Resistance, and Trendlines
There are certain key price levels that help in identifying the range from where the breakout can be seen. Here they are:
- Support: It is the area where the price is said to come with a downtrend and get a pushback. Usually, it is said that support areas have buying orders.
- Resistance: It is the area where the price is said to come with an uptrend and get a push-down. Usually, it is said that resistant areas have selling orders.
- Trendlines: Trendlines are tools that are used to join higher highs or lower lows made by the price. The upper trend line is taken as the resistance point and the lower as the support.
Different Types of Trading Strategies for Breakouts
There are many conventional patterns used for breakout trading. Some are based on patterns like:
- Rectangle
- Triangle
- Flag
- Triangles, etc
On the other hand, some are based on technical indicators like:
- EMA
- SMA
- RSI
- MACD,etc
Best Breakout Trading Strategy

There are many strategies and indicators that can be used to race breakout. Conventional traders use breakout trading strategies based on some patterns, that when a price comes out of a certain range, the breakout is expected. Whereas, if you use demand and supply theory, you can track breakouts a lot better in a faster way. Demand and supply theory helps in analyzing when the buying pressure getting low and sellers are overpowering the market and vice versa.
You can learn basic to advanced or pro-level demand and supply technical trading with us at GTF’s Advanced Technical Analysis Course. The course is a comprehensive guide to 360-degree trading strategy that works in all type of markets and helps you trade on dynamic knowledge, instead of some pre-set patterns.
Indicators and Tools for Breakout Identification
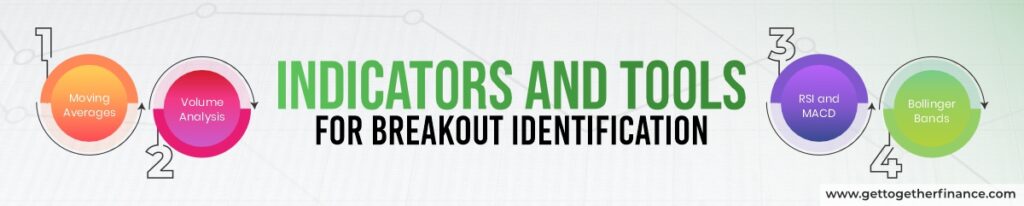
There are certain tools that are helpful in identifying the potential breakouts, these tools and indicators are widely used by conventional traders. Here are some of the most popular tools and indicators:
1. Moving Averages
- Moving averages are technical tools that smoothen the price data into linear graphs and show trend direction with the help of an averaging period.
- There are different types of moving averages, some widely used are SMA 200 and EMA 20.
- The moving average is generally above or below the candles, but when the price comes in the consolidation phase, moving averages start to merge with the candles, this signals that a breakout is nearby, whichever side the candles may move apart from the moving average, that becomes the direction of the breakout.
2. Volume Analysis
- In this, the calculation of a number of shares bought and sold in a time frame is done.
- When the trading volume is higher than normal, then break out is anticipated.
3. Relative Strength Index (RSI) and MACD
- RSI and MACD are some of the most used technical indicators by every type of trader.
- The RSI indicator helps in knowing the overbought and oversold situation in the stock. Overbought situations help in knowing bearish breakouts. The oversold situation helps in knowing the oversold situation.
- MACD helps in knowing the strength and direction of the stock’s price. The convergence point in the indicator helps in knowing the breakout point.
4. Bollinger Bands
- It is one of the other widely used technical indicators. It has three linear graphs. The middle one is known as the moving average and the upper and lower ones as outer bands.
- The point when the price starts to break from any of the outer bands, trader anticipate breakout.
Common Mistakes to Avoid in Breakout Trading

Breakout trading patterns can help traders in making good profits, but they have their own set of risks and rewards. But, here are some common mistakes that traders can avoid:
1. Entering Early
- Jumping into a trade-in feeling of greed and FOMO can turn out to be utterly risky for traders.
- Sometimes price touches the resistance and support levels, it might break the range for a bit, but then reverse, eventually trapping traders.
- To be saved from this, traders need to look for confirmations for the breakout, check that the volume has increased, and also for the candles to close above the range before entering, and always keep the stop loss intact.
2. Ignoring Market Context
- There might be scenarios where you see a breakout at short time frame charts, but on the overall market scenario and higher time frame charts, the trend may be something else. In this scenario, if you go against the higher market context in your trade, then you may incur losses.
- For example, if the NIFTY is in a bearish trend and you find a bullish breakout trade scenario in reliance, then there are high chances that the breakout can be a false breakout in reliance.
3. Overleveraging
- It is extremely risky to trade breakout patterns with leveraged money or MTF. A slight adverse market movement can wipe off the trading account quickly.
- Use the leveraged money carefully and align other strategies with your breakout strategy to find a reliable trade setup.
4. Relying Solely on Breakout Strategy
Breakout strategies were mainly used by conventional traders. But now the stocks have evolved and become more spontaneous and dynamic, solely a breakout strategy cannot be fulfilling enough for finding reliable trades. For this, one needs to have an upfront and dynamic trading strategy. Breakout trading sometimes seems very thrilling and exciting for traders. The reason behind this is that returns are quick in, meaning the fund is blocked for very little time. But, it also comes with other risks. Breakout trading is highly market sensitive, one turn in the market, and all trades can hit stop loss. This makes it a risky trading.
Now, if you want to trade breakouts, start by doing disciplined trading, start buying at good support and demand levels and selling at good resistance and demand levels.
Remember, By being a disciplined trader, you can avoid the common mistakes that traders make and be ahead of 95% of conventional traders.
Conclusion
Identifying and trading a breakout technical chart is an ultimate trading skill that comes with knowledge, patience and a trading strategy. By understanding what breakouts are, using reliable indicators like RSI, MACD, and Bollinger bands. And avoiding the common mistakes that can lead to trading false breakouts and hitting unnecessary stop losses, traders are ahead of the majority of traders in the realm and increase their accuracy rate.
Breakouts help in capturing big market movements and making profits out of them, but they also need discipline and stable risk management from the trader’s end. Whether you’re a new or seasoned trader, combining breakout tactics with broader market knowledge will help you make better judgments and produce more consistent outcomes.
Frequently Asked Questions
1. What is a breakout in a technical chart?
A breakout is when a stock price breaks a certain range and a good movement in price of the stock is seen.
2. How can I confirm if a breakout is real or false?
A breakout can be confirmed by looking for increased trading volume, seeing price closing substantially above or below the critical level, and using technical indicators such as RSI, MACD, or Bollinger Bands.
3. Which tools are best for identifying breakouts?
Moving averages, volume analysis, RSI, MACD, and Bollinger Bands are among the most used techniques. These indicators provide signals and confirmation for probable breakout events.
4. What are the risks involved in breakout trading?
Risks include falling for false breakouts, entering trades too early without confirmation, ignoring the larger market context, and overleveraging your trades.
5. Can breakout trading be used in all markets?
Yes, every market hat showcases the price on candlesticks charts, can be traded with help of breakout trading.