Zig Zag Indicator: Definition, How Pattern Is Used, and Formula
- March 7, 2025
- 514 Views
- by Manaswi Agarwal

 Instagram
Zig Zag indicator is a form of technical analysis used by traders to simplify the price action by filtering out minor fluctuations while focusing on significant market moves. Zig Zag indicators can help you identify the price trends as well as the change in price trends of the security.
What is a Zig Zag Indicator?
In technical analysis, traders use several tools to identify the price action in a security, zig zag indicator is one of those tools which filters out minor price fluctuations. The overall trend direction and potential reversal points in the chart are recognized by significant highs and lows formed in the price action. Here are the following points where zigzag indicator can be helpful to identify:
- Entry and Exit Points
- Spotting double tops and double bottoms
- Fibonacci Tools
- Harmonic patterns
- Channels and chart patterns
- Multiple Zig Zag charting
- Wolfe waves
- Keltner Channels
How does Zig Zag Indicator works?
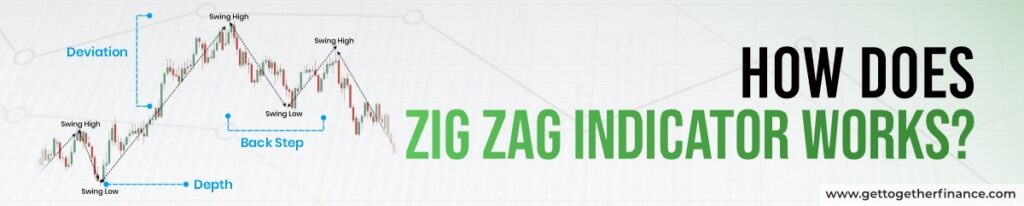
Using Zig Zag parameters help you figure out the pattern which is indicated by tolls like depth, deviation, and backstep.
Depth: A security having enough depth helps to define the swing highs and lows correctly. A trader must look at a good depth of waves between swing highs and lows to enter into a trade.
Deviation: Deviation is the percentage change in the price when changing the trend lines from positive to negative.
Back Step: Backstep refers to the minimal number of bars between the swing high and lows.
To calculate the Zig Zag Indicator:
- You need to first choose the starting point that is swing high or swing low.
- Choose percentage price movement that represents minimum price movement in percentages. Suppose with a 5% threshold, the starting point is with Rs 100, the price can either move upwards that is 105 or downwards i.e. 95 to identify a new point.
- Identify the next swing high or swing low which is the next percentage of price movement.
- Draw a trend line from the start point to the end point. Repeat the process of identifying next swing highs and swing lows and connect them with a trend line.
- Straight lines are drawn in a zig zag pattern that connects several highs and lows in the charts. In this pattern, traders eliminate random price fluctuations and attempt to show trend changes.
Pros of Zig Zag Indicator

Zig zag indicator offer several advantages when used correctly by the investors which should be thoroughly known by a technical trader. Zig Zag indicator works best in strong trending markets by avoiding extra noise levels.
Simplified Price Action
The zig zag pattern helps to simplify complex price actions into clear and understandable segments. The overall price action is simplified making it easier to analyze.
Applicable on different timeframes
Zig zag patterns can be recognized on different time frames such as daily, weekly, monthly and identify the trend at different periods.
Pattern Recognition
Zig zag indicator cannot predict future price movements but surely helps to identify the price trends and change in price trends.
Limitations of Zig Zag Indicator

As a trader, we have analyzed that the price action is followed by history and its previous movements. This is only a prediction and no one can remain certain about predicting future price action in the security.
Lagging Tool
One of the main drawbacks of using zig zag indicator is that the recent zig zag line may not be permanent. What that means is when the price changes its direction, a new trend line is drawn and if that doesn’t reaches the set percentage direction and the price reverses, then the line is replaced by an extended zig zag line which follows the trend’s original direction.
This is why the zig zag pattern is called a lagging indicator as it only plots the significant points after they have occurred and hence tend to delay the trading signals.
Parameter Sensitivity
The price action based on the zig zag indicator highly depends on its parameters like depth, derivation and backstep and the percentage threshold chosen. A trader cannot always be sure of the working of these parameters. A lower threshold might include too much noise while a higher threshold might miss significant trends.
Final Words
All in All zigzag indicators are one valuable tool to figure out price action and understand the trend of a security completely. However, getting aware of the limitations that the indicator has, demand and supply theory comes to the rescue of a trader. GTF’s trading in the zone deeply caters to the financial approach of demand and supply with its top down approach, sector support and other technical factors.
FAQs
What is a Zig Zag Indicator?
Zig Zag indicator is used in technical analysis which acts as a tool to identify the price trends and the changes in price trends by drawing trend lines from the most recent swing highs and swing lows.
How does ZigZag Indicator works?
In the zigzag indicator, a trader plots the points on the chart with pre pre-set percentage and connects the lines formed by joining swing highs and swing lows to identify the price action in a security.
What are the limitations of the Zig Zag Indicator?
Being a lagging tool and the dependence on several parameters does not offer certainty of using a zig-zag indicator.