Breaking Down Channels: A Guide to Market Patterns
- March 8, 2025
- 507 Views
- by Suhani

 Instagram
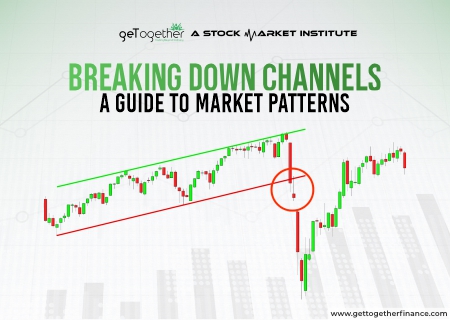
Introduction
Channels are one of the patterns that is used by traders in technical analysis. More than tools, they are just drawings made on candlestick charts. They are made of two types of lines, sometimes parallel and sometimes converging. The above line is called resistance which is made by joining the peaks made by the price of stock and the lower line is called support which is made by joining the troughs or lows made by the price. Overall, the direction of the channel helps traders determine the trend, this is mainly used by conventional traders.
Traders take the help of these channels to identify correct entry and exit points, switch detailed price action strategies, and buy or sell opportunities, depending on where the price is heading within the channel.
When the channels are marked accurately, they help traders in knowing trends and potential reversal and continuation points of trends. Overall channels help provide a clear picture of market movements that help convention traders predict future price movements and plan their trades accordingly. Let’s understand more about channels and trends with the help of this blog.
Types of Channels
Ascending Channels:
An ascending channel is formed when the direction of the channel is upward. This is made when stock prices rise and fall within two parallel lines that eventually point upward creating a bullish trend.
Descending Channels:
A descending channel is formed when the direction of the channel is downwards. This is when stock prices rise and fall within two parallel lines, eventually pointing downwards, creating a bearish trend.
Horizontal Channels: Trading in a Range-Bound Market
In a horizontal channel, the price consolidates sideways between two parallel lines, indicating a market that stays currently, with no certain direction. The upper trend line represents resistance and the lower line represents support. The price moves up and down between these levels without a clear long-term period. Traders often buy near support and sell near resistance and focus on the price range within the channel.
Identifying Channels on Price Charts
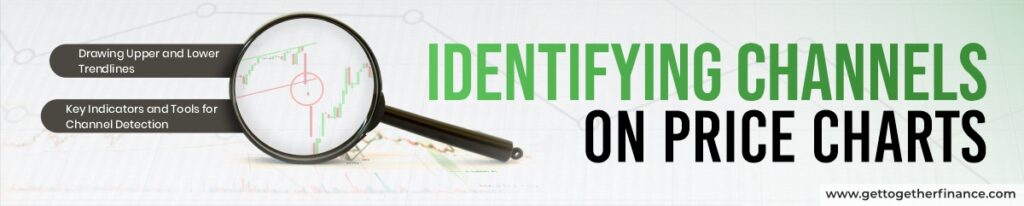
Drawing Upper and Lower Trendlines
To identify a channel on a price chart, start by the market at least two high points and two low points that the price has moved over a given period.
- Here, you’ll draw the upper trendline by connecting the highs of the range.
- A lower trendline will be drawn by connecting the lows made by the price.
- These lines should mandatorily run parallel to each other, forming boundaries of the channel.
- The more the price consolidates between the trend line without breaking them, the more reliable the channel becomes for breakout trading.
Key Indicators and Tools for Channel Detection
The majority of technical tools and indicators can help in spotting channels.
- Moving average indicates (SMA and EMAs), help in identifying general trend direction, making it easier to draw accurate trendlines.
- Secondly, the RSI (Relative Strength Index) and Bollinger bands can help in providing additional context by indicating several overbought and oversold situations. This often coincides completely with price movements within the channel, indicating potential reversal points.
- Charting platforms often have built-in tools for drawing trendlines, allowing traders to visualize channels quickly and accurately.
Trading Strategies Using Channels

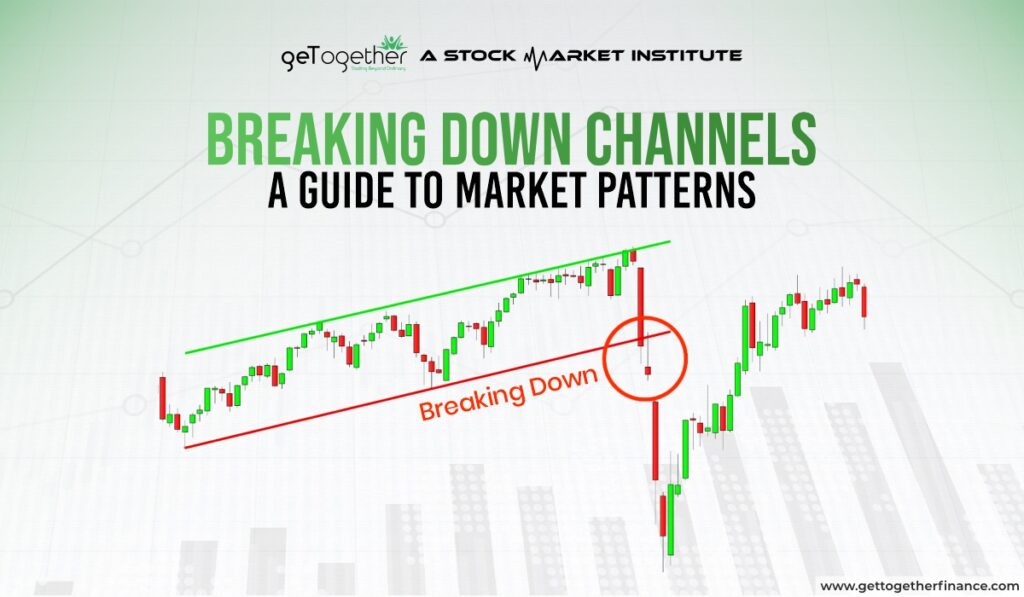
Breakout Strategy: Capitalizing on Channel Exits
The breakout trading strategies focus on profiting when the stock price breaks out of the marked channel. A strong move in the direction of breakout is a signal with this. Also in the ascending channel, when a breakout happens from the upper trend line. It suggests a bull run or continuation of an uptrend. Here, traders can gear up for long positions. In the descending channel, the breakout below the lower trendline suggests a strong downtrend. Here traders can gear up for short positions. But, to reduce risk, traders usually wait for confirmation, such as increased trading volume, before entering a trade after a breakout.
Channel Trading: Profiting from Price Oscillations within the Channel
Channel trading is also done by putting buying and selling orders at the support and resistance points.
- In this strategy, traders buy the stock when its price reaches near the lower trendline, which is the support point. They anticipate that support points will help the price in giving a good rise again.
- The strategy also has effective and stable market conditions. Stable, means when the price of stock is consistently consolidating between support and resistance points without any external market, or noise manipulation done by people.
- It requires close monitoring of the channel and disciplined execution to capitalize on the predictable price swings.
Risks in Channel Trading

- False Breakouts: Stock price may briefly breach the channel trendlines, leading to false breakout signals. This can trigger false orders or stop-loss orders placed near trend lines, reversing the trend, and resulting in unnecessary losses for traders waiting for the actual breakout.
- Channel Breakdown: There are some times when the unexpected ups and downs in market sentiment can cause the stock to breach the stock price suddenly, leading to potential losses if the trader is on the wrong side of the move.
- Over-Reliance on Channels: It is never advisable to focus solely on channel trading without any support. Solely focusing on channels in the charts can make traders overlook other important market indicators, such as demand and supply dynamics or broader market trends, which might affect the asset’s price.
- Volatile Markets: In highly volatile markets, weak channels may not be followed as per our expectations, leading to sudden price movements that make it difficult to trade within the channel to maintain consistency.
- Missed Opportunities: only adhering to channel boundaries for trading purposes might cause traders to miss significant price moves that occur outside the channel and have the potential for high returns.
At Last
Channeling in technical analysis is an effective strategy for traders to spot patterns, forecast price changes, and make sound trading decisions. Traders who understand how to design and analyze channels can optimize their entry and exit points, manage risk properly, and capitalize on market opportunities. However, it is critical to understand the hazards, such as false breakouts, and the limitations of depending entirely on channels. Markets can be unpredictable, and channels may not always hold, particularly during tumultuous periods. To be successful in channel trading, traders must combine it with other technical indicators and keep a flexible approach. This allows traders to better manage the complex situations that are in the current stock market, which eventually helps in increasing the chance of making good profits while minimizing losses.
Frequently Asked Questions
1. What is a channel in technical analysis?
A channel in technical analysis is a price pattern formed by two parallel trendlines. The upper trendline (resistance) connects the highs while the lower trendline (support) connects the lows.
2. How do I draw a channel on a price chart?
To draw a channel, find at least two high and two low points on the chart. Connect the highs and lows with upper and lower trendlines, respectively.
Also, you need to ensure that the lines are parallel and are in line to fit the price change from peak to low.
3. What is the difference between an ascending channel and a descending channel?
In the ascending channel, the trend lines are directed upwards, which shows that the price is in an uptrend and can continue to go up. Whereas the opposite happens in the descending channel, it indicates that the price is in a bearish move and can continue to go down the direction of descending trend lines.
4. How can I use channels for trading?
The situation when the market is a rangebound situation that is, it cannot move past a certain range. That is the time when channels can help traders identify the breaker points.
5. What are the risks of trading with channels?
False breakouts, in which the price briefly swings outside the channel before returning to the prior trend, potential losses from unexpected market movements, and over-reliance on channels without taking other indicators into account, are all risks. Channels may also lose reliability in highly turbulent markets.