Renko Chart: Definition, What It Tells You, Uses, and Example
- April 16, 2025
- 502 Views
- by Manaswi Agarwal

 Instagram
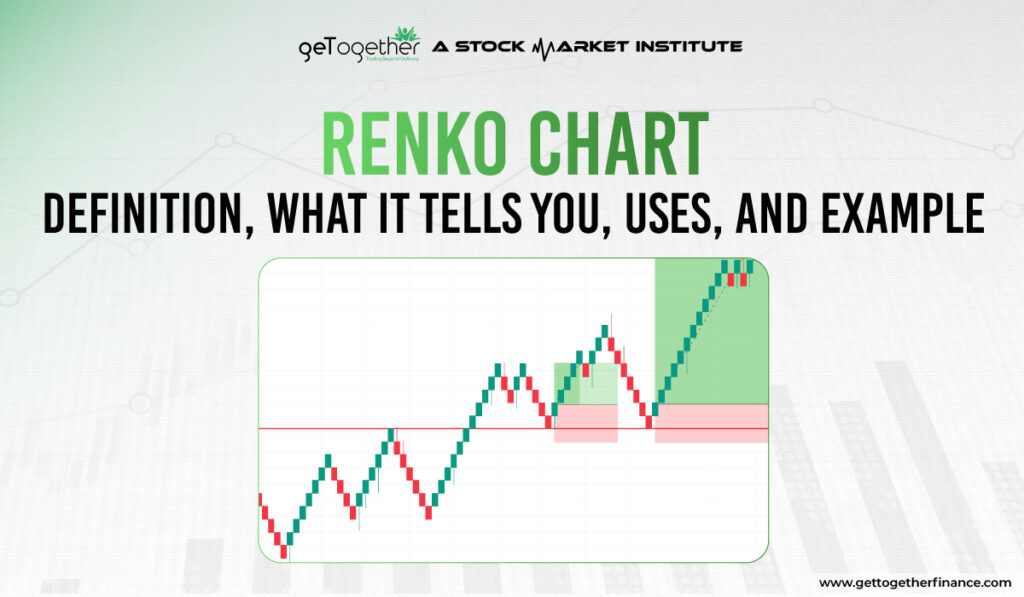
Renko charts is a type of technical analysis that is simply based on price movements and highlights significant trends to reduce the market noise so that traders can avoid making false decisions. It is effective to spot clear trends in the security and potential reversal through price movement. This brief guide will help you acknowledge the use of renko charts in technical analysis.
What is a Renko Chart?
Renko charts is a part of Japanese technical analysis which tends to predict price movement in a security instead of analyzing both price and standardized time intervals like other chart patterns. A renko chart used to filter out small price moments and health traders to conduct easy analysis by focusing on important trends. Renko chart contains bricks which are placed at 45 degree angles to one another and consecutive bricks do not occur beside each other.
Renko charts provide a broad view of technical analysis by visually analyzing the charts and provide a cleaner trading experience.
How to use Renko Charts in Trading?
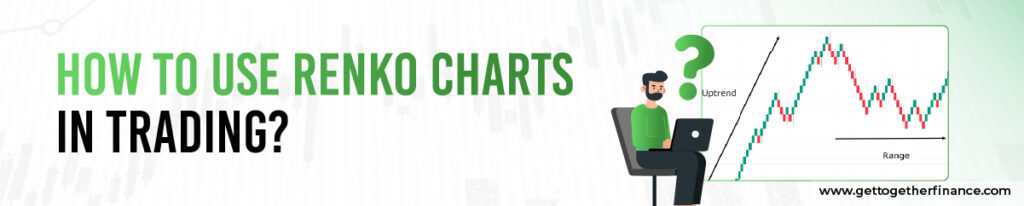
A renko box is a form of a brick which indicates the trend in a security which forms a renko box size depicting the unit of measurement on the chart. A renko box size depends on the parameters that you want to consider that forms a trend. To use renko charts in trading:
- Set the brick size to filter out the movements.
- Identify the Trend: Green bricks: uptrend, red bricks: downtrend.
- Confirm the signals with technical indicators like moving averages, RSI and others.
Brick Types in Renko Charts

Bullish Bricks: The formation of bullish bricks that consist of white or green candlesticks indicate an upward price movement in the security.
Bearish Brick: The formation of bearish brick is ascertained when the chart forms black or red candlesticks to signify a download price movement in the security.
Advantages of Renko charts

To enhance your decision making process in trading with the use of identification of trends and recognizing support and resistance levels, consider these practical ways to gain advantage while trading with the Renko chart pattern.
Identification of Trend
The brick size represents the formation of a particular train in the security and hence it signifies a series of consecutive green bricks to indicate an upward trend while a series of red blocks indicates a down trend in an asset.
Support and Resistance
Many traders recognise support in resistance level to trade the security where using renko chart makes it easier to spot the support and resistance levels that can be used to identify potential break out points as well as set stop loss orders for risk management.
Identifying Trend Reversal
Trend reversals can be easily recognized as it offers when the direction of the brick changes after following a particular trend.
Buying or Selling Pressure
A renko chart signifies a buying momentum when traders observe continuous formation of green bricks after a series of red candles. This indicates an increased buying pressure in the security indicating a potential bullish reversal. The bullish trend is confirmed when continuous green candles are formed that gives a buying signal.
Challenges of Renko Charts

Like other chart patterns, trading through renko charts also has limitations and traders should get informed about these drawbacks before entering into a trade pattern through renko charts.
- Renko charts does not consider the price element which is a limitation for some traders because they considered the time aspect as an important factor to predict future price movements.
- Renko charts only rely on significant price moments and trends of the security for analysis which cannot be enough for a trader to make an effective decision that can potentially affect timely decision making.
- False signals are prominent through renko charts which make it necessary for traders to consider other important technical patterns to confirm the signals of trend formation.
- Traders cannot manage their risks efficiently using renko charts as they are associated with quite complicated calculations.
End Words
Renko charts help to spot clear trends in the asset to help traders signify the price movements. However, using candlesticks is more appropriate as it is much more reliable and provides extra data about price movements. Demand and supply theory makes efficient use of candlesticks charts which helps a trader to make effective decisions.
FAQs
What are Renko Charts?
Renko charts are derived from the Japanese technical chart patterns with a word “bricks” to visually portray price fluctuations that are simply based on the price action and trend movement in the security. Renko charts do not consider time and volume while analyzing the future price action.
How to trade through Renko Charts?
To trade through the renko charts, you can analyze the trend reversal or continuation in the trend by identifying the box sizes.
What are the benefits of Renko Charts?
Renko charts offer simplicity in use and display price movements by cutting extra noise in the market and avoiding the clutter of time intervals as well as other extraneous data.
What is the best box size for Renko?
The best box size is determined as per the trader’s risk tolerance, time horizon and trading goals. Each trader follows a different strategy to understand the price action and hence there is no standardized best box size for renko.