Abnormal Return: Definition, Causes, Example


Overview
Investing world is full of numbers, but one key metric separates the good performers from the rest: abnormal return. Abnormal returns, also referred to as excess returns, are a valuable finance metric, especially the stock market. The concept helps investors focus on improving returns and managing risks, whether experienced or new.
The blog helps explore the meaning of abnormal returns, emphasizing its importance in the investment world. This will further go into its calculating formula and how to calculate it for improved returns on your investment.
What Is An Abnormal Return/Excess Returns?

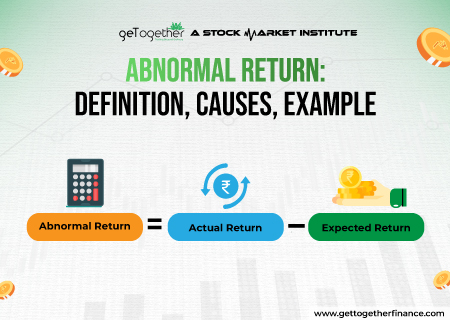
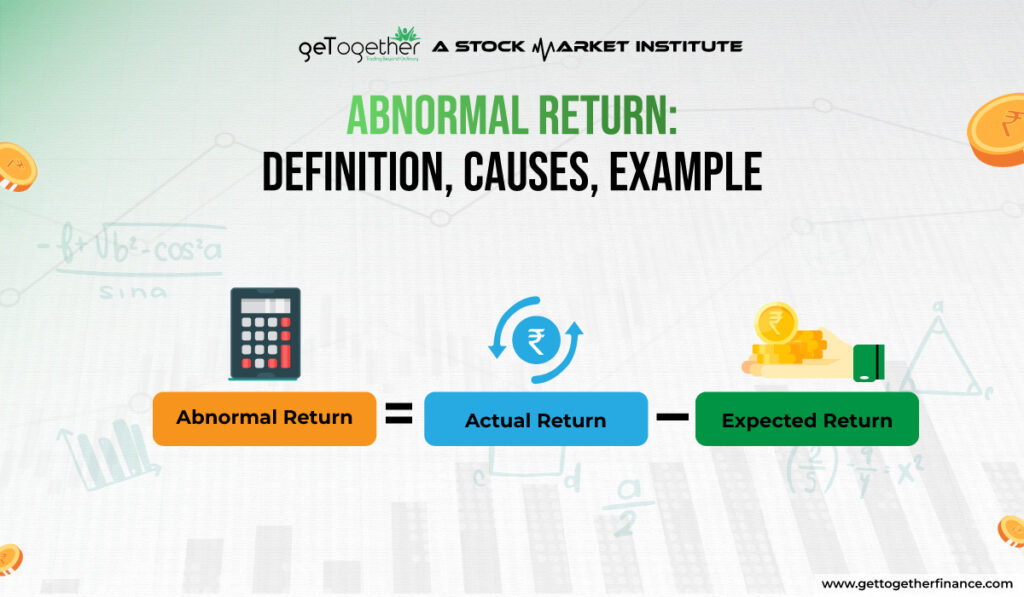
An abnormal return is a term used in finance to define the difference between the actual return of an investment and its expected return. This expected return is typically based on the investment’s risk level and is often calculated using models like the for the market average return.
Here’s a more detailed breakdown:
- Expected Return: The return that an investor anticipates receiving based on historical data and models that consider the investment’s risk and market conditions.
- Actual Return: The return that the investment actually generates over a specific period.
- Abnormal Return/Excess Returns: The difference between the actual return and the expected return. It can be either positive (when the actual return is higher than expected) or negative (when the actual return is lower than expected).
In simpler terms, an AR tells you how much your investment outperformed (positive excess returns) or underperformed (negative excess returns) the market after considering the inherent risk. It’s basically a measure of your stock-picking skills or strategy compared to the baseline market performance.
Formula for Abnormal Return (AR)

Here is the formula for calculating abnormal return (excess return):
Formula of AR = Actual Return – (Risk-Free Rate + Expected Market Return)
Here:
- Actual Return: The percentage return you earn on your investment over a specific period.
- Risk-Free Rate: The return you would get from a risk-free investment, like government bonds.
- Expected Market Return: This can be estimated using various methods, often based on historical market performance or a benchmark index like the Nifty 50 in India.
How To Calculate Abnormal Return

To calculate the expected return, we can use the Capital Asset Pricing Model (CAPM). The following is the equation for the model:
Er = Rf + β (Rm − Rf)
Here,
- Er = Expected return in the security
- Rf = risk-free rate, generally the rate of a government security or savings deposit rate,
- Beta(β) = risk coefficient of the security or the portfolio in comparison to the market,
- Rm = Return on the market or an appropriate index for the given security such as Nifty 50.
Once we have the expected return, we subtract the same from the actual return to calculate the abnormal return. When the portfolio or security has underperformed expectations, the AR will be negative.
Otherwise, it will be positive or equal to zero, as the case may be.
As per the careful approach, it is better to look at the risk-adjusted return. This is in keeping with the concept of risk tolerance because otherwise, the portfolio manager may differ from the IPS goals and take up highly risky investments to generate abnormal returns/excess returns.
In the case of multiple periods, it may be helpful to look at the standardized returns to see if the portfolio is constantly beating the benchmark.
Example of Abnormal Return/Excess Returns
Let’s update the example with the new values:
- Risk-free rate (RfR) = 4%
- Market return (RmR) = 12%
- Beta (β) of the portfolio = 1.5
- Beginning value of the portfolio = ₹50,000
- Ending value of the portfolio = ₹60,000
Step 1: Calculate the Expected Return using Capital Asset Pricing Model (CAPM)
The Capital Asset Pricing Model (CAPM) formula is:
Er = Rf + β (Rm − Rf)
Adding in the new values:
Er = 4% + 1.5 × (12% − 4%)
Er = 4% + 1.5 × 8%
Er = 4% + 12%
Er = 16%
So, the expected return on the portfolio is 16%.
Step 2: Calculate the Actual Return
The actual return (RaR) can be calculated based on the beginning and ending values of the portfolio.
Formula of Actual Return (Ra) = Ending Value − Beginning Value/Beginning Value × 100%
Ra = ₹60,000 − ₹50,000₹/50,000 × 100%
Ra = ₹10,000/₹50,000 × 100%
Ra = 20%
Step 3: Calculate the AR
Now let’s put the value into the excess returns or AR formula to get the final number.
AR = Actual Return (Ra) − (Risk-Free Rate (Rf) + Expected Market Return (Rm))
AR = 20% − (4% + 12%)
AR= 20% − 16%
AR = 4%
In this instance, the AR is 4%. This shows that the portfolio has outperformed the expected return based on its risk level and the overall market return.
Also Read: Binary Options
Importance of Abnormal Return/Excess Returns

Not all investment returns are created equal. While the raw percentage change might seem like the whole story, a deeper metric called “abnormal return” or “excess returns” reveals a more nuanced picture. This metric goes beyond simply tracking gains or losses; it measures how much your investment outperformed or underperformed the market after considering the inherent risk.
Here’s why abnormal returns hold such significance for investors:
Identifying Opportunities
Positive abnormal returns (excess returns) can indicate that an investment has outpaced expectations, potentially signaling an undervalued stock or a smart investment strategy. By assessing companies with consistent positive AR, investors can potentially uncover hidden gems with high growth potential.
Evaluating Performance
Abnormal returns (excess returns) help investors assess the effectiveness of their investment choices or those of a portfolio manager. Studying AR provides valuable insights for making informed investment decisions such as the performance of stocks relative to the market, etc.
Market Efficiency
Abnormal returns (excess returns) can act as a gauge of market efficiency. If a large number of investments consistently generate positive AR, it might suggest the market is not fully capturing all available information, potentially revealing opportunities for skilled investors.
In essence, AR offer a window into the true performance of your investments relative to the market. They empower you to become a more informed investor, identify undervalued assets, evaluate investment strategies, and potentially outperform the market over time.
Conclusion
Understanding abnormal returns empowers you to become a more informed investor in the stock market. It allows you to assess your investment choices, evaluate portfolio managers, and potentially identify opportunities to outperform the market. Remember, AR are just one piece of the puzzle. Consider factors like your risk tolerance and investment goals when making investment decisions. You can also consult with a financial advisor who can provide valuable guidance tailored to your financial circumstances.
FAQs
How is Abnormal Return (excess returns) different from Regular Return?
Regular return simply refers to the percentage change in the value of your investment over a specific period. AR takes this a step further by considering the expected return based on factors like the risk-free rate and a benchmark index (like Nifty 50).
What does a positive Abnormal Return (excess returns) mean?
A positive AR indicates that your investment has outperformed the market after adjusting for risk. This could be due to factors like a strong company performance, successful stock picking, or market timing.
What does a negative Abnormal Return (excess returns) mean?
A negative AR suggests your investment has underperformed the market after considering risk. This doesn’t necessarily mean it’s a bad investment, but it might be worth investigating the cause.
Is Abnormal Return (excess returns) the same as Alpha in investing?
Yes, AR is essentially the same concept as Alpha. Both terms refer to the excess return generated by an investment compared to a benchmark after adjusting for risk.
Can Abnormal Return (excess returns) help me identify undervalued stocks?
Stocks with consistently positive AR might be undervalued, but further research is needed to confirm. Consider factors like company fundamentals and future growth prospects.
How do I calculate Abnormal Return (excess returns) using a sectoral index in India?
The calculation is similar to using Nifty 50. Replace the “Expected Market Return” with the return of the relevant sectoral index or other specific sectors.


 Facebook
  Instagram
  Youtube
