 Facebook
  Instagram
  Youtube
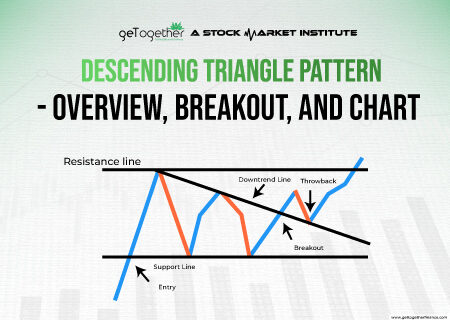
Triangle chart patterns such as ascending triangle pattern, descending triangle pattern and symmetrical triangle pattern are some essential tools that are used by traders to determine the prices of assets…

Meet the visionary behind it all - our brilliant founder, Arun Singh Tanwar, the man who radiates the spark of knowledge, commitment & dedication. Our founder led the stepping stone of GTF in 2019 with a vision of creating brilliant traders across the country. With a clear vision and positive outlook from the past 4 years, GTF is working to elevate the graph of traders in India, and as of now, we have successfully imparted trading education to more than 2.5lakh people. Our Founder bold strategies and techniques make him a goal-driven optimist and a Proficient trader, excelling in the stock market for more than 8 years! We are proud to say that our founder has not left a single stone unturned in converting his vision into reality and is still continuing to help people in gaining financial independence.
Triangle chart patterns such as ascending triangle pattern, descending triangle pattern and symmetrical triangle pattern are some essential tools that are used by traders to determine the prices of assets…

In this blog, we are going to unravel every aspect of NISM certification courses, like What is NISM, Why you should consider NISM certification courses, and obviously, how can we…
In the fast-paced world of trading, it is essential to have tools and strategies that can help traders optimize their investment decisions. One such tool is the GTT (Good Till…

In the realm of finance, commodities trading occupies a distinct niche, offering investors unique opportunities to diversify their portfolios and speculate on the future prices of essential goods. This article…
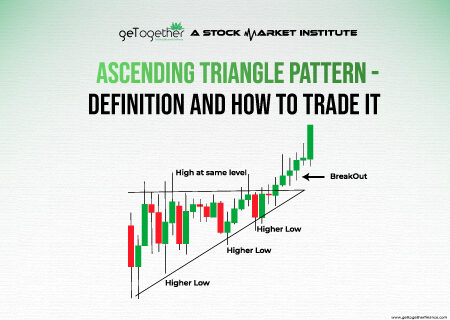
The ascending triangle pattern is a popular chart pattern used in technical analysis to identify potential bullish breakouts in the market. Traders and investors often use this pattern to make…
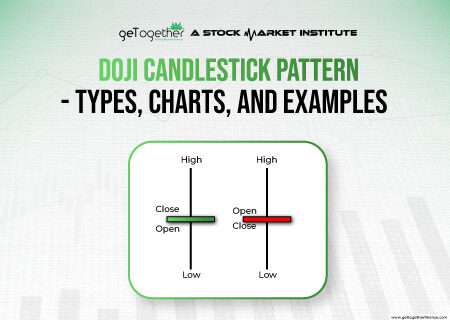
In the intricate world of stock markets, the language of candlestick patterns serves as a nuanced guide for astute investors and traders. Among these patterns, the enigmatic Doji candlestick pattern…
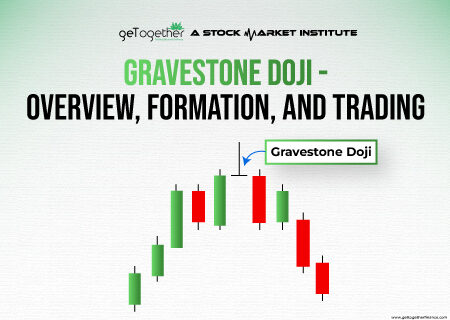
The Gravestone Doji is a candlestick pattern frequently used in technical analysis to identify potential trend reversals in financial markets. It is considered a bearish reversal pattern and is characterized…
When talking about trading, technical analysis plays an instrumental role in identifying trends and patterns in the price movements of stocks. In technical analysis, chart patterns are among the most…
