 Facebook
  Instagram
  Youtube
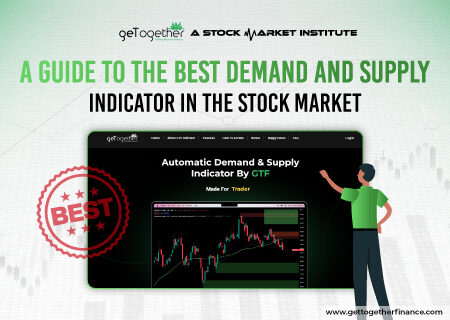
Overview Trading in the stock market is not less than solving a puzzle, especially when it comes to identifying those crucial demand and supply zones. These are the price zones…

Meet the visionary behind it all - our brilliant founder, Arun Singh Tanwar, the man who radiates the spark of knowledge, commitment & dedication. Our founder led the stepping stone of GTF in 2019 with a vision of creating brilliant traders across the country. With a clear vision and positive outlook from the past 4 years, GTF is working to elevate the graph of traders in India, and as of now, we have successfully imparted trading education to more than 2.5lakh people. Our Founder bold strategies and techniques make him a goal-driven optimist and a Proficient trader, excelling in the stock market for more than 8 years! We are proud to say that our founder has not left a single stone unturned in converting his vision into reality and is still continuing to help people in gaining financial independence.
Overview Trading in the stock market is not less than solving a puzzle, especially when it comes to identifying those crucial demand and supply zones. These are the price zones…
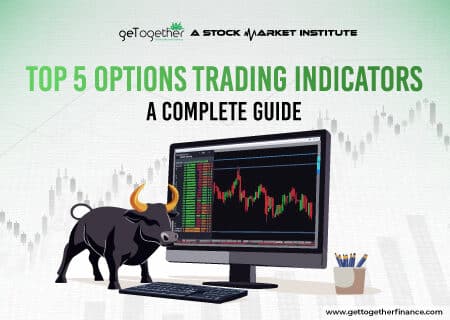
Overview Options trading has both its appealing and scary aspects. Compared to stock trading, options have additional elements, such as implied volatility, strike prices, and expiration dates, that make them…
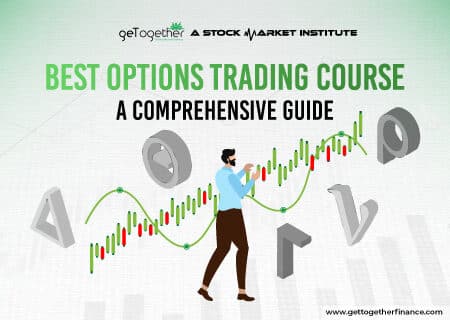
Overview Options trading is one of the quickest ways to gain wealth. However it can also be the quickest way to lose your money too. Even studies show that almost…

Overview The stock market has endless potential for profit, but only for traders who are knowledgeable in it. Whereas a lot of people imagine making money from stock trading, the…
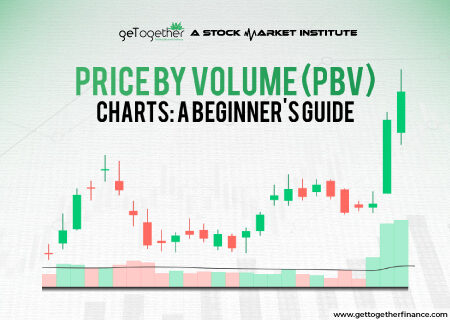
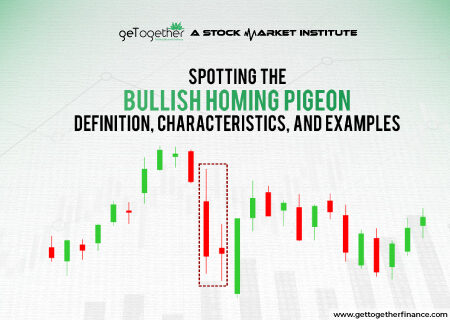
Most retail investors look at price movements based on volume in charts. Seeing the craze for this technique, the modern market has introduced some fascinating charts that not only track…
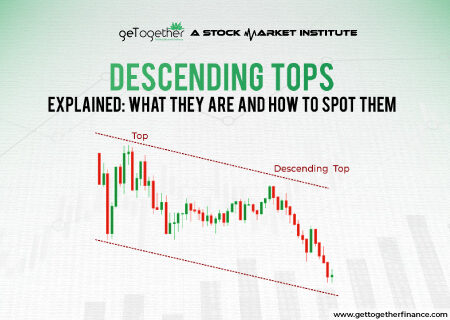
Overview There’s a good chance you’ve come across the words “descending” or “ascending,” but what do these patterns mean when they appear on a candlestick chart? A descending tops pattern…
Overview Stock market is vast like a wild ocean and tossing your investments around like a tiny boat in a storm? If not know how to decode these waves, trading…
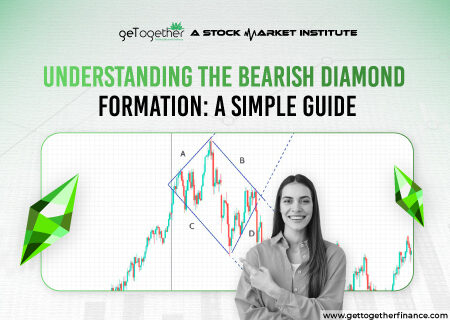
Overview Have you ever seen a stock price chart that looks like a diamond? It might seem pretty, but don’t be fooled—this pattern can signal an upcoming bear hit! Among…
