 Instagram
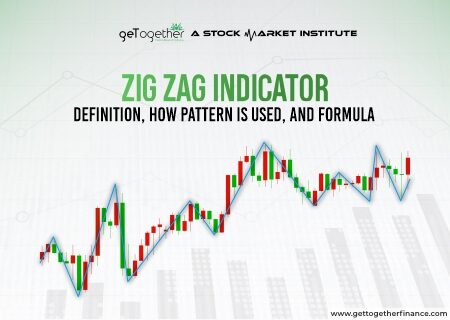
Zig Zag indicator is a form of technical analysis used by traders to simplify the price action by filtering out minor fluctuations while focusing on significant market moves. Zig Zag…

Meet the weaver of words and a sorcerer of finance storyteller, Manaswi Agarwal, who can convey unfiltered data into golden nuggets. In GTF, content writing is about being a relentless researcher and conquering the digital realm through financial knowledge. With a vision of transforming mundane topics into meaningful insights and wisdom since two years, she has been constantly honing her craft while staying versed with the industry trends. She puts her knowledge in writing as a blend of creativity and craftsmanship to meet the growing landscape of content creation. Her work focuses to illuminate GTF students towards the path of stock market literacy with each word that she writes.
Zig Zag indicator is a form of technical analysis used by traders to simplify the price action by filtering out minor fluctuations while focusing on significant market moves. Zig Zag…
Buying shares during a dicey situation psychologically impacts your decisions. A trader has to follow some important rules and one of them is to be conservative about the trades. A…
It is one of the misconceptions that you require financial advisory in order to grab good investment opportunities. Who needs a financial advisors when you yourself can become capable of…

Manufacturing fund NFO or thematic funds are equity oriented new mutual fund schemes that particularly invest in the manufacturing sector. The funds mainly target the companies indulged in manufacturing belonging…
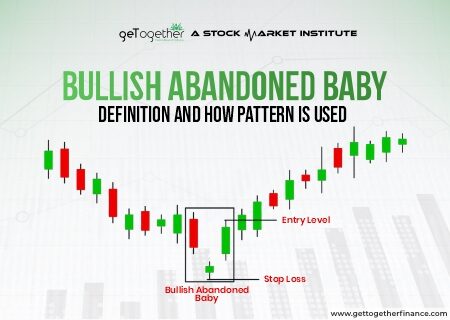
Bullish abandoned baby candlestick pattern recognises a bullish reversal in the security and is considered to be very effective to establish long positions in the asset. In this blog we…
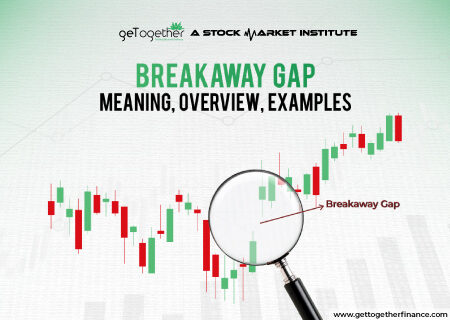
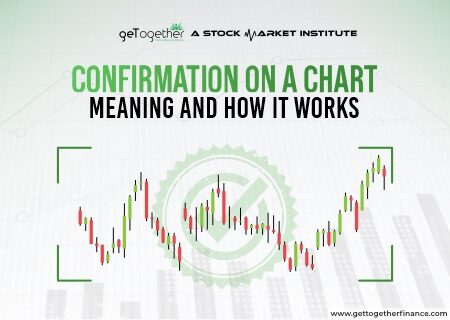
Gap Trading is well known by traders as the prices tend to fluctuate due to uncertain market conditions and result in giving gaps. It is way more important to realize…
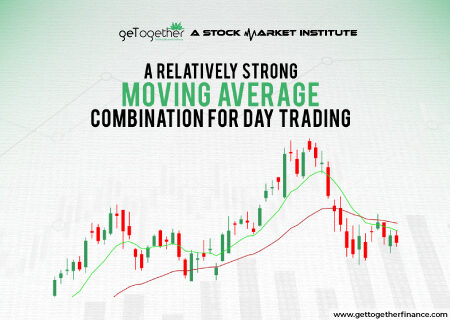
In Day trading, moving averages play a major role to guide traders about the trend in a security. A trend can be downwards, upwards or sideways in the market. But…
To be a trader who relies on technical analysis to achieve efficiency requires a strategic combination of quality education, practical experience and latest technology. Dive into this blog to know…
