Bullish Abandoned Baby: Definition and How Pattern Is Used
- February 27, 2025
- 1726 Views
- by Manaswi Agarwal

 Instagram
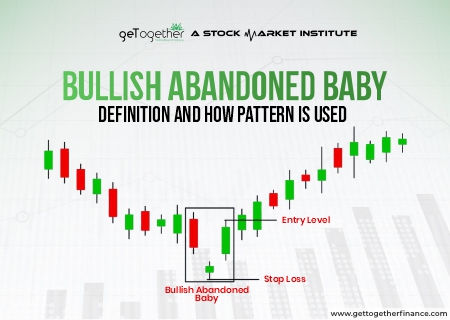
Bullish abandoned baby candlestick pattern recognises a bullish reversal in the security and is considered to be very effective to establish long positions in the asset. In this blog we will undiscover how to trade bullish abandoned baby candlestick chart patterns and how traders make decisions to trade this particular pattern.
How does a Bullish Abandoned Baby Candlestick Form?
When the security continuously follows a down trend in the market, the formation of bullish abandoned baby candlestick recognizes the trend reversal at the bottom of the price chart and hence signifies a bullish momentum. However, many traders are confused and find it difficult to identify the formation of bullish abandoned baby candlesticks on the chart. The following points discuss the steps to step formation of this pattern to clarify your questions.
The pattern consists of three candles:
First Candle- Drop or Legin
The first candle is a red legin or a drop in the market prices which indicates that the sellers are dominant and hence the security is bearish.
Second Candle – Base / Doji
The second candle is a base candle or a doji candlestick which recognizes a fight between the sellers and the buyers. The candle is indecisive in nature as it describes that none of the market participants is in a win-win situation. This candle is perceived as a strong candle to signify the science of trend reversal where the traders can enter into long positions.
Third Candle – Legout
The third candle is the legout candle or a huge green candle with a good closing that aims to signify the strength of buyers. The formation of a third candle in the security indicates that buyers are in a win-win situation and are able to take the prices upwards.
For example;
- If stock ‘A’ opens at Rs100, trades lower, and closes at Rs90, forming a large bearish candlestick in the first trading session.
- In the second trading session, stock gaps down, opening at Rs85, and trades within a narrow range (closing near the open, forming a doji at Rs85).
- The pattern completes in the last trading session when the stock gaps up, opening at Rs92 and closes strongly at Rs105, forming a large bullish candlestick.
How to Trade a Bullish Abandoned Baby Candlestick Pattern?

Now let us consider when to trade the bullish abandoned baby candlestick pattern and where to place the entry, exit points.
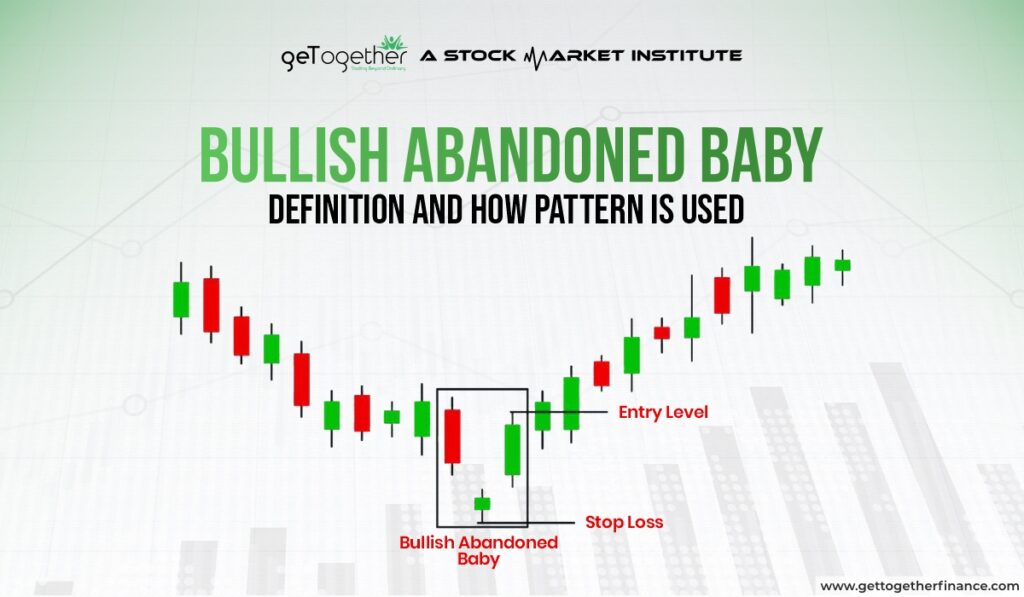
Entry Point: The entry is placed when the pattern is completely formed after the third candle and it gives a perfect closing indicating a bullish trend to continue in the security.
Stop Loss Order: The stop loss order is placed below the low of the doji candlestick as when the price breaks that particular level it signifies that the trend is not favorable and to avoid further risks of losses.
Profit Targets: Traders can effectively realize their profits at the supply zone of a higher time frame or at their desired profit levels.
Is a bullish abandoned baby candlestick pattern similar to a demand zone?

Demand zone is an area which identifies the potential of buyers to push the prices upwards in a security. The pattern looks similar to a demand zone, however there are several criterias that must be fulfilled to take an entry in a demand zone. A demand zone must be supported by the sector, top down approach analysis as well as higher time frames. The demand zones give the confirmation of a bullish momentum in the security and they are traded when the price gives a pull back towards the zone.
Analyze the Pattern formation with Trade Setup

In order to analyze the bullish abandoned baby candlestick pattern in technical analysis, an individual have to follow the given steps:
Identify the Downtrend
Identify the downward trend in the asset as well as make sure that the market is making lower highs and lower lows which significantly represents a downward move in the security.
Analyze the Three Candles
First Candle: Analyze the first candle which is the beginning of the bullish abandoned baby candlestick pattern as it is a huge red candle formed indicating a selling pressure in the asset.
Second Candle: The second or the doji candle must be analyzed as it should open below the low of the first candle.
Third Candle: Set up the trade when the pattern is completed after the third huge green candle indicating an increased buyers pressure in the prices.
However the accuracy of the bullish abandoned baby candlestick pattern is subjective as traders have different opinions regarding the further movement of prices.
Limitations of Bullish Abandoned Baby Candlestick Pattern

Even after the formation of a correct pattern, the upward move cannot be assured as the price movements are dependent on several market factors like strength of the trend, time frame and overall market conditions.
Limited Opportunity
The pattern occurs rarely in the chart formation and the traders get limited opportunities to spot the pattern and take an immediate action on the trade. Hence, traders need to find other opportunities through which they can sustain in the stock market.
Market Volatility
Stock market is very unpredictable and traders can never have 100% accuracy which requires them to follow reliable trading strategies and patterns that can even sustain during increased market volatility.
Inefficiency
Trading on bullish abandoned baby patterns can be quite inefficient as it does not allow you to properly manage the risks. Using demand and supply is one and only efficient method to get the entry and exit point with proper risk management.
Conclusion
The bullish abandoned baby candlestick pattern indicates a bullish reversal in a security after a strong downtrend. But as we know these patterns are not reliable, a strong approach is required to get your hands perfect on trading.
FAQs
What is a Bullish Abandoned Baby Candlestick Pattern?
A Bullish Abandoned Baby candlestick pattern is formation of three candles after a downtrend that signifies a bullish reversal in the security when the third candle gives a perfect reversal.
Can I trade on the Bullish Abandoned Baby pattern?
Trading solely on Bullish Abandoned Baby is not completely reliable as you need to focus on several other technical and market factors that can have a potential impact on the move of the security.
What is the difference between a bullish abandoned baby and morning star?
The middle candle in Bullish abandoned baby forms below the lower wick of both the adjacent candles. While in the morning star, the doji candle can form at the lower shadows as well.