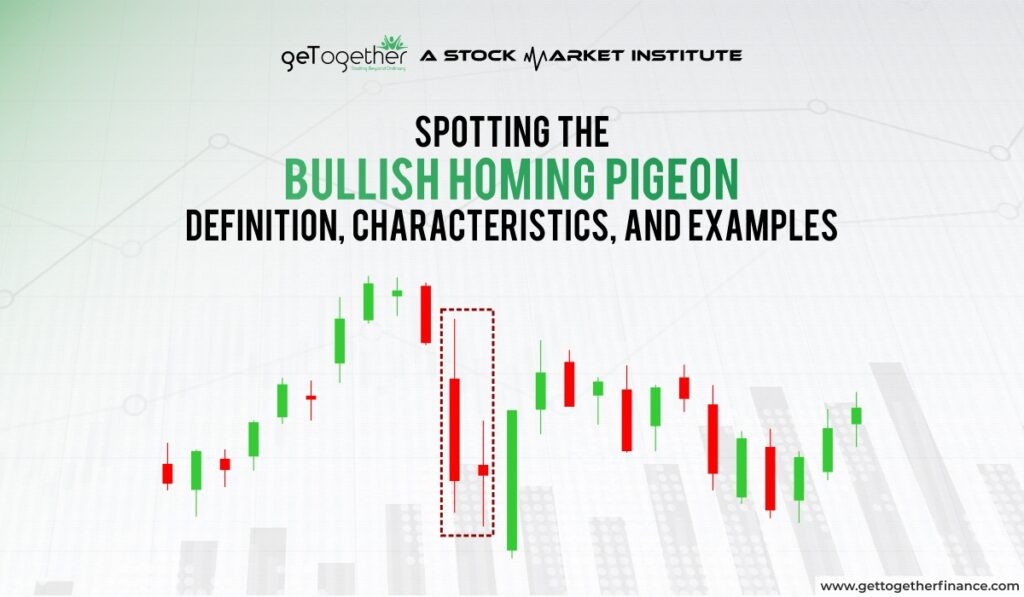
Spotting the Bullish Homing Pigeon: Definition, Characteristics, and Examples
- February 7, 2025
- 9702 Views
- by Arun Singh Tanwar

 Facebook
  Instagram
  Youtube
Overview
Stock market is vast like a wild ocean and tossing your investments around like a tiny boat in a storm? If not know how to decode these waves, trading can be a pretty overwhelming experience, especially for beginners.
However, to guide how to sail, there are a handful of technical chart patterns and theories, helping traders predict market moods in those choppy waters. One such pattern is Bullish Homing Pigeon. However, this formation is more than just a pretty view, it may signal traders that the selling pressure is easing up and buyers are starting to step in.
In this blog we will understand what is bullish homing pigeon, what is its formation and how you can use it to make smarter trading decisions. So let’s begin.
What is Bullish Homing Pigeon
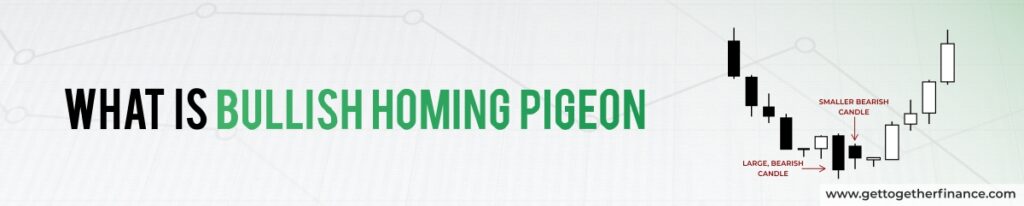
The Bullish Homing Pigeon is a candlestick pattern that hints at a possible market comeback. It’s a two-candle setup that’s like the Bullish Harami and is basically the bullish version of the Descending Hawk. They’re all part of the harami family.
But here’s the thing —some research suggests it might actually signal that the market’s still headed down as prices don’t always fall in a straight line. During a downtrend, prices often drop, take a breather, and then continue lower. So, the Bullish Homing Pigeon could just be a little pause before the price heads south again.
Formation of Bullish Homing Pigeon
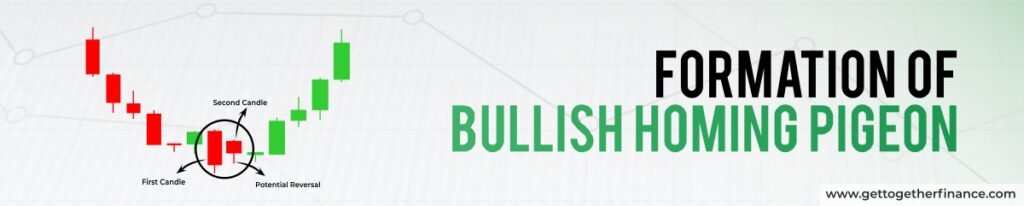
The formation of a Bullish Homing Pigeon is pretty straightforward. It happens during a downtrend when the market is falling. Let’s see how it works:
- First Candle: You see a long red candle, indicating strong selling pressure and that the market is moving lower.
- Second Candle: The next day, a smaller red candle appears. This candle’s price range is contained within the range of the first candle, suggesting that the selling is slowing down.
- Potential Reversal: The smaller candle signals that the market might be ready to turn around. It’s a sign that buyers could be starting to take control, leading to a potential rally.
Conditions of Bullish Homing Pigeon
To identify a bullish homing pigeon formation, you need to check off two important conditions:
- Condition 1: Both of the candles should be red (bearish). The first candle must be bigger than the second one.
- Condition 2: The second candle must fit entirely within the body of the first candle.
This pattern usually shows up after prices have been falling or during a brief pause in a rising market.
The Psychology Behind Bullish Homing Pigeon Pattern
When the market is going down, the demonstration of selling can be seen with the first red candle that appears with a large body. The second smaller red candle forms inside the first candle, suggesting that the selling pressure is starting to weaken. This could mean that buyers are beginning to step in.
Because of this shift in sentiment, the bullish homing pigeon pattern often indicates that the market might reverse direction and start moving up after it appears.
How to Trade the Bullish Homing Pigeon

Here is how you can use Bullish Homing Pigeon to enter trade and make profit:
Identify the Pattern
First, spot the Bullish Homing Pigeon pattern on your chart. It usually shows up during a downtrend when the market might be ready to turn around.
Wait for Confirmation
Don’t rush in. Wait to see if the price holds and consolidates or starts to rally from there. This could mean buyers are taking control.
Set Your Entry Point
Once the price begins to rally after the Bullish Homing Pigeon pattern and breaks above the high of the second candle, consider entering the trade. This could be your signal that the market is shifting.
Risk Management
What often traders miss is a strategy to manage risks as standalone technical chart patterns guarantee outcome.
Bullish homing pigeon formation is good for traders to spot trend reversals, however pairing it with profound technical theory demand and supply can help create a strong trading setup.
Here is how you can enter and Trade this using demand-supply theory:
Check the Demand Zone
Mark for a nearby exceptional demand zone, which is an area where buyers are likely to step in and push prices up. If the pattern forms near this zone, it strengthens the chances of a rally.
Mark The Supply Zone
Keep an eye on the nearest supply zone—an area where sellers might step in and slow down the rally. You might want to consider this as a potential exit point.
Use a Stop-Loss
Place a stop-loss below the demand zone or the low of the pattern to protect yourself in case the market doesn’t rally as expected and continues to drop.
Position Sizing
Decide how much to invest in a trade based on how much risk you’re comfortable with and the money in your account.
Diversification
It’s crucial to know that you should not put all your money in one trade. Make sure to use not more than 1% of your overall funds on a single trade.
Ratio of Risk-Reward
Decide a risk-reward ratio before you enter a trade (1:1 or 1:2). Set realistic and favorable targets.
Monitor the Trade
Keep track of how the price moves towards the supply zone. If the rally loses momentum, it might be a sign to take profits or adjust your strategy.
Even though there is no profound theory of technical analysis in the stock world, it’s best to create a robust trading setup and manage your risk for due diligence. You can easily learn basics of demand-supply theory with their free YouTube classes available on the GTF channel. For additional backup, you can use other technical indicators such as moving averages, MACD, etc. To your chart.
Conclusion
The Bullish Homing Pigeon pattern is one of the valuable and handy patterns. The formation can tip help investors tip off to a possible market turnaround, hinting that prices might be ready to rally. But let’s be real, we all know that the market can be unpredictable and things don’t necessarily go as you imagine. That’s why it’s smart to use a stop loss to keep your losses in check if things head south. For a stronger strategy, it’s highly suggested to mix this formation with other technical indicators and methods to get a clearer picture before making your move.
FAQs
How common is the Bullish Homing Pigeon pattern?
It’s not the most common pattern, but it does appear often enough to be useful, especially in trending markets.
Why is it called the Bullish Homing Pigeon?
The name comes from the idea that the pattern “homes in” on a potential reversal, similar to how a homing pigeon returns home.
Can the Bullish Homing Pigeon pattern signal the end of a market correction?
Yes, it can indicate that a market correction might be ending, with prices potentially ready to rally again.
How do I confirm the pattern before trading?
Wait for the price to hold in the demand zone and start rallying before entering the trade. This confirmation increases the pattern’s reliability.
Can the Bullish Homing Pigeon pattern fail?
Yes, like any pattern, it’s not foolproof. That’s why it’s important to use it with other tools like demand-supply zones and stop-losses.