Candlestick with No Shadow: How Science Explains Market Confidence?


So, if you’re into candlestick chart patterns for your technical analysis, you’ve probably noticed that most of the time, candles have this thick body with “tails” at either end. Those “tails” are called wicks or shadows, and they tell us a lot about price action during a given time period. But once in a while, you might come across a candlestick with no shadow. No tails, no wicks. It’s a little weird, right?
What does that mean exactly? Does it mean the market didn’t move at all? Or that the price didn’t go anywhere significant? Not really. In fact, these “no-shadow” candlesticks can be pretty revealing about market momentum, strength, and even signal potential trend changes.
Let’s break it down and see why this could be important for traders.
Table of Contents
ToggleCandlestick with no shadow: What Are They Really Telling Us?

A candlestick chart is a simple but powerful tool that shows us how prices move over a set time period, whether that’s one minute, one hour, or even a whole day. The shape, color, and shadows (or wicks) of the candle provide insights into what’s going on in the market—how buyers and sellers are interacting and battling it out.
And trust me, these candlesticks aren’t just random shapes. Each one has a story to tell. Here’s a quick refresher on what a typical candlestick looks like and what it means:
Anatomy of a Candlestick: Let’s Keep It Simple

If you’re a little confused by all the terms, no worries. Let’s break it down into three basic parts:
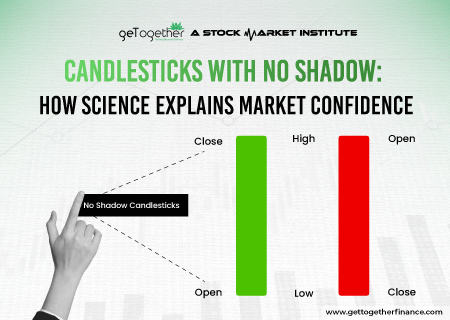
- The Body – This is the thick part of the candlestick with no shadow. It shows the opening and closing prices. If the body is green (or hollow), it means the price closed higher than it opened. If it’s red (or filled), the price closed lower than it opened.
- The Shadows (or Wicks) – These are the thin lines above and below the body. They represent the highest and lowest prices that were hit during the time period of the candle.
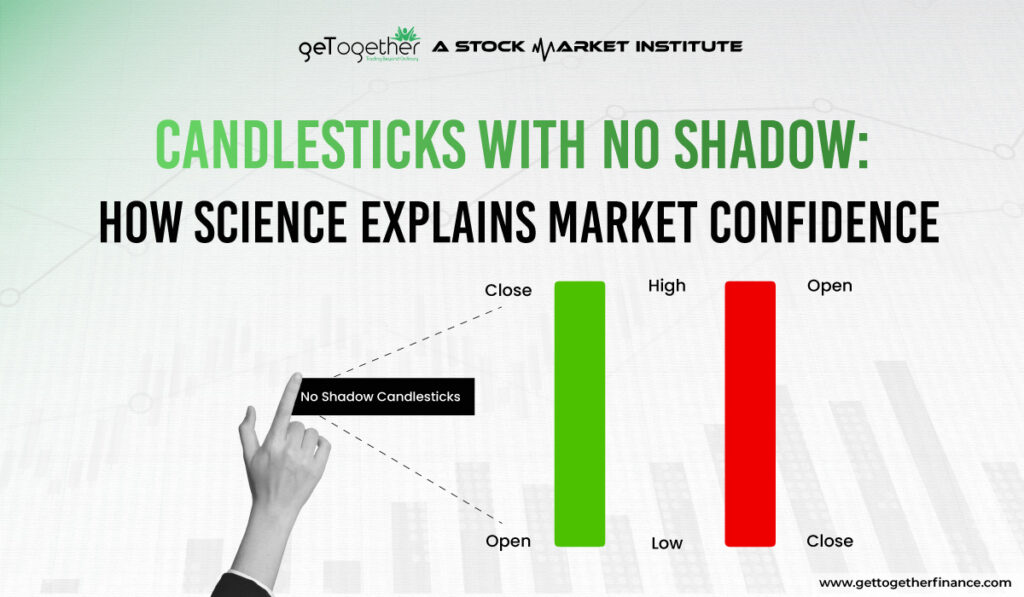
- No Shadows – When you see a candle with no shadows, it means the highest and lowest prices were exactly the same as the opening and closing prices. So, the price stayed within a narrow range without much fluctuation.
Candlestick With No Shadow: The Game Changer

So, what happens when there’s is a candlestick with no shadow? It’s a pretty clear signal. This happens when the highest and lowest prices are exactly the same as the opening and closing prices. Basically, the price didn’t fluctuate at all during that period. It’s a straight line—no surprises.
Now, here’s where it gets interesting for traders: a candlestick with no shadow (or what we call a Marubozo) says a lot about market confidence. Depending on which direction the candle is pointing, it tells you if buyers or sellers were in control. If the price closed at the highest point, with no dip, it suggests buyers dominated the market. On the flip side, if the price closed at the lowest point, with no rally, it’s a sign sellers were in charge.
What Is a Marubozo Candle?

A Marubozo is a very specific type of candlestick. The term comes from Japanese and means “shaved head” or “close-cropped.” Why? Because a Marubozo has no “hair“—no wicks or shadows at either end. It’s just a solid-colored body with no markings outside the opening and closing prices.
Think of it like this: a candlestick with no shadow represents a market that is confident, unwavering, and totally sure of its direction. There’s no hesitation. It’s a statement candle that tells us one thing—this is how things went down.
Bullish Marubozo: Buyers Are in Full Control
A bullish Marubozo happens when the price opens at the lowest point and closes at the highest point, leaving a clean green (or white) candle.
- In an Uptrend: If this appears in an ongoing uptrend, it’s a strong sign that buyers are pushing prices higher, which means the uptrend might continue.
- At the End of a Downtrend: If you spot this at the end of a downtrend, it could mean buyers are stepping in, and we might see a potential reversal. In other words, it could be the start of an uptrend.
Bearish Marubozo: Sellers Have Taken Over
On the other hand, a bearish Marubozo shows that the price opened at the highest point and closed at the lowest, leaving a solid red (or black) candle.
- In a Downtrend: If this appears during a downtrend, it suggests sellers are dominating and the downtrend is likely to continue.
- At the Top of an Uptrend: A bearish Marubozo at the peak of an uptrend could be a warning sign that sellers are stepping in. This might mark the beginning of a reversal from an uptrend to a downtrend.
Also Read: Doji Candlestick
The Science Behind Marubozo: Why No Shadow?

Now, let’s get a bit scientific (but just a bit). In the world of physics, when an object casts no shadow, it could mean that it’s either transparent, super thin, or it’s being lit in such a way that no light is blocked.
The same logic applies to Marubozo candlesticks. A candlestick with no shadow shows that there’s no opposition—no resistance from buyers or sellers during that time period. The market is moving in one clear direction. It’s kind of like the market is transparent, with nothing getting in the way of the movement.
Why Do Candles With No Shadows (Marubozo) Matter?
Marubozo candles, whether bullish or bearish, are a powerful signal in technical analysis. They show us that the market has clear momentum and that buyers or sellers are in control. If you’re a trader, you’ll want to pay attention to these candles because they can provide valuable insight into current market sentiment or hint at potential trend changes.
It’s like the market is saying, “This is the direction we’re heading!” No guessing, no confusion—just a straight-up indicator.
Final Thoughts
You might think that shadows on a candlestick chart are just small, insignificant details. But they carry big weight. They show us where prices hesitated, where buyers or sellers tested the waters before finally settling down. By paying close attention to these details, you can get a better idea of market sentiment and trend strength.
Think of shadows like footprints left by traders. They tell us the story of where prices went and where they found support or resistance. And with time, you’ll get better at reading these patterns and use them to make smarter trading decisions.
FAQs
Does a Marubozo guarantee that the trend will continue?
No, it’s a strong signal, but like any pattern, it’s not foolproof. You should confirm with other indicators and market conditions.
Should I combine Marubozo with other indicators?
Yes, it’s always a good idea to combine a candlestick with no shadow with other indicators (like Demand-Supply Dynamics, volume, or moving averages) to confirm the trend.
Can Marubozo candles form during consolidation?
Not often. Marubozos usually appear during active price moves, either at the start of a trend or after a price correction.
Does the size of a Marubozo matter?
Yes, a larger Marubozo candle shows more power in the move, while a smaller one may signal less strength but still indicates a strong trend.


 Facebook
 Instagram
 Youtube
