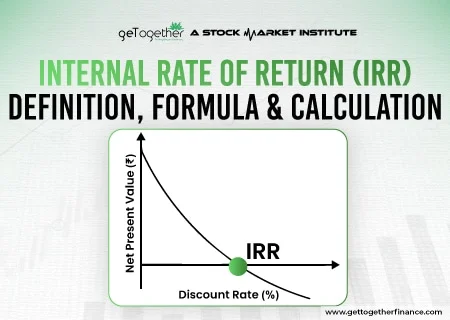
Introduction to Internal Rate of Return One of the biggest challenges you face as an investor is correctly estimating the return on investment. Especially when the revenues from the project…
Looking to grow your wealth through the stock market? This guide is your go-to resource for understanding the ins and outs of investing. Start building your portfolio today!
Introduction to Internal Rate of Return One of the biggest challenges you face as an investor is correctly estimating the return on investment. Especially when the revenues from the project…

Introduction We loosely use the term inflation in our daily lives to talk about the rising prices of goods and services. When the prices of goods rise, it also brings…
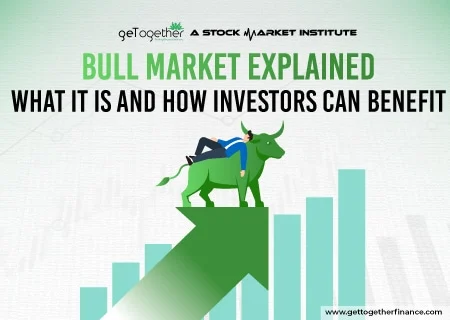
Introduction You must have read the headlines talking about the bull market and the bear market all the time. But have you wondered what is a bull market and why…
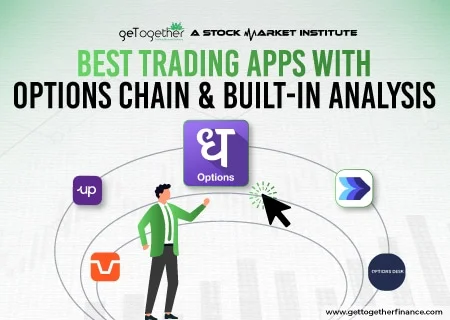
Options trading requires access to powerful tools and up-to-date information. Mobile trading apps have changed the way traders interact with the markets. These apps are good for both new and…
![Best Options Trading Apps in India [2026 Guide]](https://www.gettogetherfinance.com/blog/wp-content/uploads/2025/06/Best-Options-Trading-App-in-2025-Small-1.webp)
Trading options in India have become much easier due to the rise of apps with smart features, low-cost services and simple designs. In 2026, people involved in options trading expect…

When trading options, using the right platform can make a big difference. It helps you plan, place, and adjust your strategies more easily. With built-in strategy builders, users can set…
