
Overview Options trading is one of the quickest ways to gain wealth. However it can also be the quickest way to lose your money too. Even studies show that almost…
Looking to grow your wealth through the stock market? This guide is your go-to resource for understanding the ins and outs of investing. Start building your portfolio today!
Overview Options trading is one of the quickest ways to gain wealth. However it can also be the quickest way to lose your money too. Even studies show that almost…
![Best Certification Course in Stock Market [2026 Guide]](https://www.gettogetherfinance.com/blog/wp-content/uploads/2025/03/Best-Certification-Course-in-Stock-Market-Your-Path-to-Success-small.webp)
Overview The stock market has endless potential for profit, but only for traders who are knowledgeable in it. Whereas a lot of people imagine making money from stock trading, the…
RBI is the apex body of the Indian financial system which aims to regulate the overall economy of the country by controlling, issuing and maintaining the money supply in the…
Introduction The study of economic moats helps in knowing the competitive advantage the company has. It is similar to most castles that helps protect the castle. This concept was introduced…

Introduction Channels are one of the patterns that is used by traders in technical analysis. More than tools, they are just drawings made on candlestick charts. They are made of…
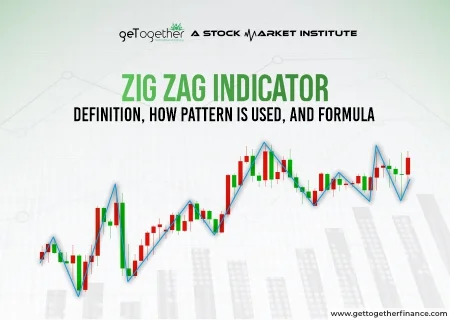
Zig Zag indicator is a form of technical analysis used by traders to simplify the price action by filtering out minor fluctuations while focusing on significant market moves. Zig Zag…
