
 Instagram
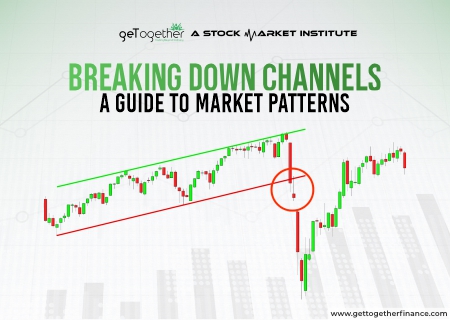
 Introduction Channels are one of the patterns that is used by traders in technical analysis. More than tools, they are just drawings made on candlestick charts. They are made of…
Introduction Channels are one of the patterns that is used by traders in technical analysis. More than tools, they are just drawings made on candlestick charts. They are made of…
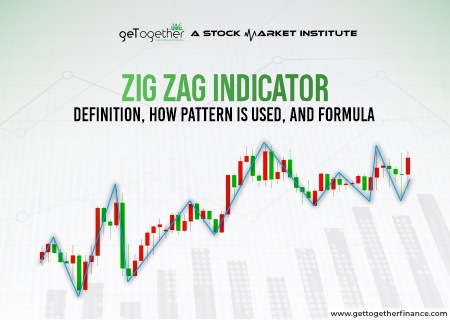
Zig Zag indicator is a form of technical analysis used by traders to simplify the price action by filtering out minor fluctuations while focusing on significant market moves. Zig Zag…
Buying shares during a dicey situation psychologically impacts your decisions. A trader has to follow some important rules and one of them is to be conservative about the trades. A…
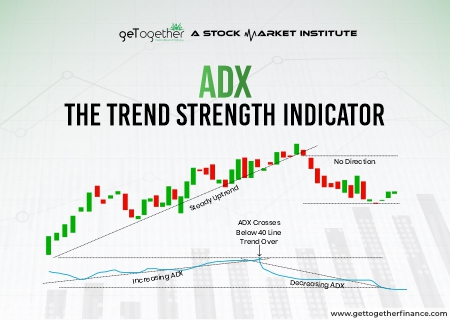
ADX, full form, Average Direction Index is a technical indicator that is used by traders to know the strength of trends, but not its direction. It simply helps traders to…
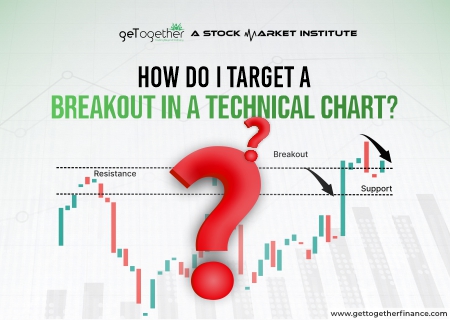
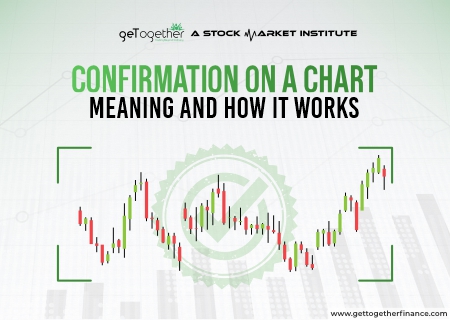
Introduction In the realm of technical analysis, a breakout in the technical chart is taken as the green signal by traders, who are looking for opportunities to enter in trade….
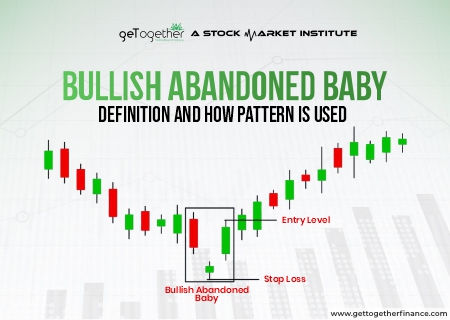
Bullish abandoned baby candlestick pattern recognises a bullish reversal in the security and is considered to be very effective to establish long positions in the asset. In this blog we…

