What Are Fibonacci Retracements and Fibonacci Ratios?
- December 8, 2024
- 2334 Views
- by Manaswi Agarwal


Fibonacci Retracement is a tool of technical analysis used by traders to determine the potential support and resistance levels which drives the price movement in a security. The retracement levels are derived from the Fibonacci ratios through a well renowned Fibonacci series. The Fibonacci ratios provide price levels to which markets tend to retrace a portion of a downtrend or uptrend move.
This blog will deeply guide you about the use of Fibonacci retracement in trading.
Table of Contents
ToggleWhat are Fibonacci Retracements?
Fibonacci Retracement in technical analysis is based on the mathematical concept that helps traders to identify buying or selling areas in the stock. Fibonacci retracement determines the level of prices where support and resistance could occur. Fibonacci is a mathematical tool that deeply considers technical aspects in stock trading.
Math behind Fibonacci Retracements

Leonardo Fibonacci, a mathematician born in 1170 AD derived the Fibonacci sequence of numbers with a well known Fibonacci golden ratio. Fibonacci sequence represents a series of numbers where the next number is the sum of preceding two numbers.
Example of Fibonacci Series: 0,1,1,2,3,5,8,13,21,34,55,89,144, and infinity.
In this series, you can easily ascertain that the following number in the series is the sum of preceding two numbers.
Fibonacci Ratio

A Fibonacci ratio is derived when the number of the series is divided by the preceding number, each time the ratio derived is 0.618 or 1.618 or 61.8% which is known as the Golden Ratio. For example; 144/89 or 89/55 so on.
Also, consistent ratios are derived when the number is divided by the number two places or three places higher. For example; 13/34 = 0.382 or 13/55 = 0.236
The key Fibonacci ratios used are 23.6%, 38.2%, 61.8%, 78.6% and 161.8%.
Fibonacci Retracement in Technical Analysis

When the price of a stock moves either upwards or downwards following a particular trend sharply, it tends to retrace back to a certain level before giving the next move. When it retraces back before its next move, there are defined Fibonacci retracement levels that help traders to forecast the change in direction of the prices.
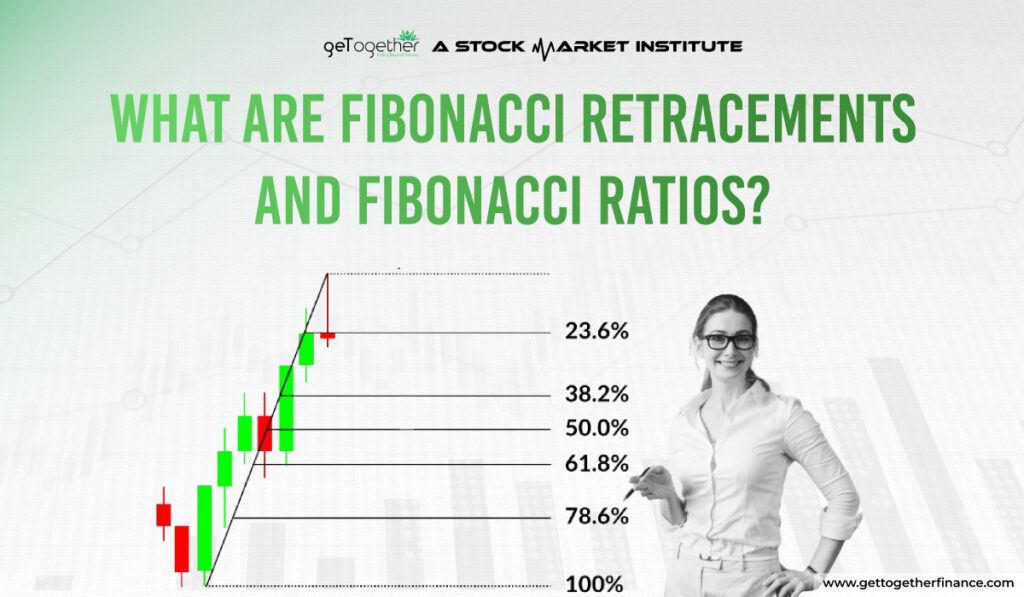
Retracement level forecast is a technique used in technical analysis to analyze the levels till the prices can retrace. These levels determine good opportunities for traders to make new positions in respect of the trend. The levels are placed according to the Fibonacci ratios which are 61.8%, 38.2% and 23.6%.
The level of 50% is not considered under the Fibonacci retracement but in technical analysis it is taken care of because the prices tend to retrace at the level of 50% as per experienced traders.
Let us understand the whole concept with the help of an example;
Suppose the stock is moving in an uptrend where the prices have risen from Rs100 to Rs200, a pullback is expected within this range. The total Fibonacci move between the range is of Rs100. The price can correct up to certain Fibonacci levels:
- 23.6% retracement which is Rs 176.4
- 38.2% retracement which is Rs 161.8
- 50% retracement which is Rs 150
- 61.8% retracement which is Rs 138.2
A continued upward movement in the prices can be watched around these levels acting as support or resistance levels. Traders carefully analyze the price action at these levels to determine buying opportunity.
Fibonacci Extensions

Now as we know that Fibonacci Retracement is used to anticipate the pullback in a stock’s prices, similarly, Fibonacci extensions are used to examine how far the price move could extend beyond the previous high or low level. Fibonacci extension ratios are greater than 100% with the levels marked as 161.8%, 261.8% and 423.6% used by traders to set their targets in direction of the trend.
Why are Fibonacci Levels important?

Fibonacci Levels are popular among technical traders because of several reasons:
Widespread Use
Technical traders mark Fibonacci levels to determine the retracement levels and a large number of trading communities are dependent on this mathematical calculation. Many people act similarly based on the same information that fulfill trade requirements.
Applicable on Different Assets
The main purpose of Fibonacci retracements is to anticipate how far the pullback may go in an ongoing trend. It is applicable on different asset classes like stocks, index, commodities, forex, crypto currencies, etc.
Objectivity
Unlike other technical analysis methods or indicators, Fibonacci retracement is objective in nature as it is purely based on mathematical calculations. The levels are calculated mathematically which ignores subjectivity and difference in opinion. It offers an objective method to identify potential support and resistance levels.
Efficiency
Fibonacci retracements can be used efficiently when combined with other useful technical indicators and using appropriate risk management measures through stop losses.
Limitations of Fibonacci Retracements

Just like other technical indicators and tools, Fibonacci retracement is not 100% foolproof because of market uncertainties. Stock market is unpredictable and no indicator or analysis method can give 100% accuracy of a move in the asset’s prices. Fibonacci retracement levels are derived from the experience of traders as in previous years the Fibonacci levels acted as a confirmation tool to recognize the pullback move.
One notable disadvantage of Fibonacci retracement is that there are multiple levels from where the prices may reverse. A bounce back in the prices does not ensure a complete reversal in the security as there are further levels of retracements. Hence it requires a comprehensive approach by considering various other technical factors while applying Fibonacci retracements into trading strategy.
To overcome this limitation, traders can instead make effective use of the demand and supply approach which is comparatively more reliable. It also takes care of risk management by determining exact stop loss orders. Learn the advanced concept from Trading in the Zone course.
You can watch the below youtube video for more understanding.
The Bottom Line
A trader uses fibonacci retracement levels to identify the potential support and resistance areas which helps to predict future movements in the security. It is a powerful tool when associated with other advanced technical approaches.
FAQs
What is Fibonacci Retracement?
Fibonacci Retracement level indicates possible locations of support and resistance levels associated with Fibonacci ratios. The levels determine how much the prices can be retracted.
What is Fibonacci Ratio?
A Fibonacci ratio is derived through a mathematical calculation from the Fibonacci series: 0,1,1,2,3,5,8,13,21,34,55, and so on. It helps to determine the pullback levels in an asset’s prices.
How to use Fibonacci Retracement in trading?
To use Fibonacci retracement in trading, place horizontal lines at 23.6%, 38.2%, 50%, and 61.8% levels and recognize pullback either in downwards or upwards direction.


 Instagram
