
In the world stock market filled with intricacies, traders are constantly looking for profitable opportunities. Technical patterns and indicators are a form of identification of those profitable opportunities in the…
In the world stock market filled with intricacies, traders are constantly looking for profitable opportunities. Technical patterns and indicators are a form of identification of those profitable opportunities in the…

Jumping into the stock market without learning the basics is like jumping into a river without knowing how to swim—you’re more likely to sink than swim. The stock market is…

Did you know that 45% of young adults (under 35) in India now prefer stocks as their go-to investment choice? That’s straight from IBI, 2025, and it marks a big…

The plea submitted by the ministry of petroleum and natural gas to ban the diesel passenger vehicles in India has created a chaos for the investments in the automobile sector….
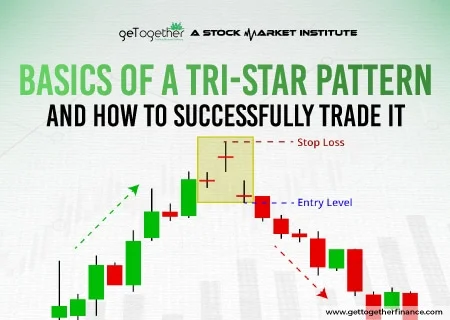
In the world of financial markets, you must have come across various trading chart patterns with a number of trading strategies. Tri-Star Pattern is one strategy that attracts you each…

“We’ve all heard the ancient Indian adage, “गुरु बिन ज्ञान अधूरा,” which means “without a mentor, knowledge remains incomplete.” These timeless words perfectly go in the stock market, a space…
