What Is a Pennant Pattern in Technical Analysis?
- September 19, 2024
- 1151 Views
- by Arun Singh Tanwar

 Facebook
  Instagram
  Youtube
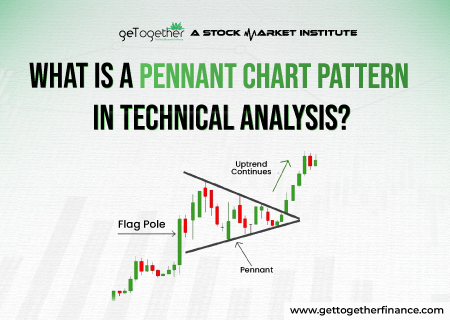
The market is all about predicting what’s coming next and finding opportunities to profit from those shifts. Over time, traders have meticulously studied market history and noticed that certain patterns tend to repeat, each hinting at what the future might hold.
Among the many ways to read the market, conventional chart patterns stand out, offering insights into the age-old question: what’s next? One such pattern is the Pennant chart pattern. A Pennant pattern in technical analysis is like a “time-out” in the middle of a game, where the market takes a short break before continuing in the same direction.
In this blog, we’ll explore what the Pennant pattern is, how it works, and what it signals when it appears on a chart. So, without further ado, let’s begin with.
What Is Pennant Pattern?

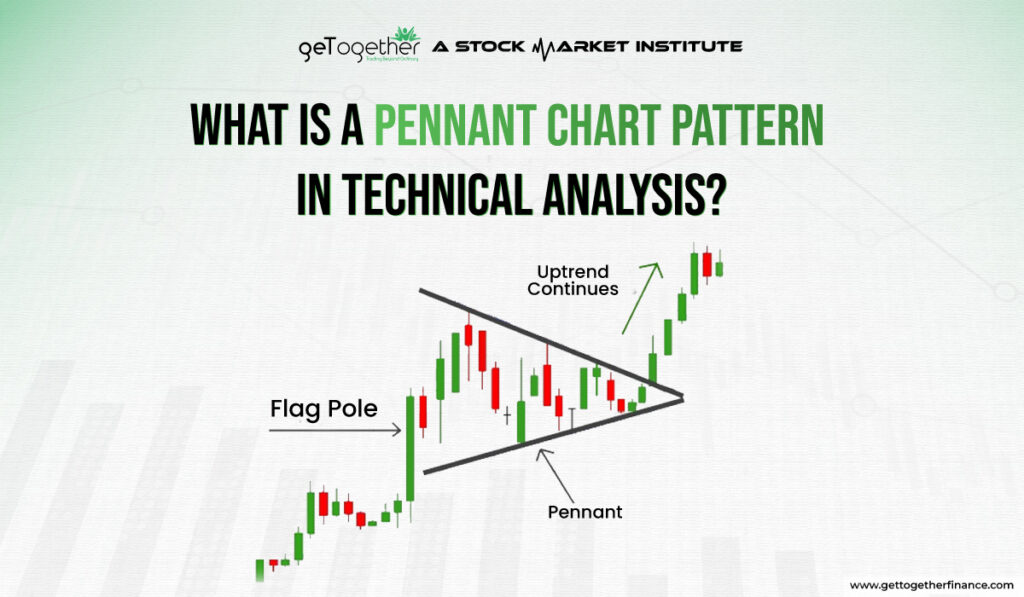
A Pennant pattern in technical analysis is a continuation pattern that takes a short pause or break in a strong price rally, followed by a breakout in the same direction as the initial move. Typically, it appears on the chart after a strong downtrend or uptrend, where the price hang around for a while. During consolidation, it forms a small, symmetrical triangle, shaping like a flag pole with a Pennant on top.
Key Characteristics of a Pennant Pattern
Pennant patterns have a few key characteristics that traders should keep in mind:
- Pennants are usually short-term patterns, lasting anywhere from a few days to a couple of weeks.
- During the consolidation phase, trading volume typically falls.
- The pattern is formed by converging upper and lower trend lines, creating a pennant shape.
- The breakout from the pennant should follow the direction of the prior trend.
Formation of Pennant Patterns
Pennant formation can indicate both bullish and bearish direction as it is a continuation phase, signaling there is a whole new rally to come next. Here is the process of formation that this pattern follows:
Initial Trend (Flagpole)
The pattern starts with a sharp price movement, either up or down, creating the flagpole, posing a strong trend.
Consolidation (Pennant)
After this strong move, the price enters a consolidation phase, forming a small triangle as it makes a series of lower highs and higher lows. This looks like a small symmetrical triangle, tiny ‘flag’ pattern or a “pennant.” This is the period where the market waits to catch a breath
Breakout
Eventually, the price breaks out of this consolidation phase, typically in the same direction as the initial trend. This breakout is often verify the pattern and lead a strong trading volume.
Continuation & Confirmation
The breakout usually leads to a continuation of the initial trend, meaning the price keeps moving in the same direction as before the pennant formed.
Traders look for Pennant patterns to spot when the market is likely to keep going in the same direction after a quick pause. Whichever direction it goes, whether uptrend or downtrend, it often shows an upcoming trend continuation to its traders. Let’s know it’s Benefits and setbacks.
Also Read: Evening Star Pattern
Benefits and Risks of Pennant Patterns

There is an old say, “with revolution comes peace and with perks comes setback”. Though poles apart, both good and bad are two sides of the same coin. It’s always the way one looks at.
Akin to this, Pennant patterns has both benefits and certain setback as no theory is yet proven foolproof in the finance or stock world. Here let’s take a look at some pros and Cons of Pennant patterns:
Benefits of Pennant Patterns:
- Confirms the Trend: These patterns show that the current trend (up or down) is likely to continue, helping traders feel more confident about the direction of the market.
- Clear Trade Signals: When the price breaks out of the pennant, it gives a clear signal to traders about when to buy or sell, making it easier to make decisions.
- Big Potential Moves: Because pennants often follow a strong price move, the breakout can lead to significant gains if the trend continues.
- Easy to Spot: This pattern is relatively easy to recognize on charts, so even beginners can use them to make trading decisions.
Risks of Pennant Patterns:
- False Signals: Sometimes, the price might break out of the pennant but then quickly reverse direction, leading to losses.
- Short Duration: Pennants don’t always last long, so you might not have much time to react, especially in a fast-moving market.
- Volume Issues: For a pennant to be reliable, there should be increasing trading volume. If the volume is low or inconsistent, the pattern might not be as trustworthy.
- Market Volatility: In highly volatile or unpredictable markets, these patterns might not work as well, making it harder to follow the expected trend.
While pennant patterns can be helpful for identifying potential trading opportunities, it’s important to be aware of their limitations and use them as part of a broader trading strategy.
Trading with Pennant Patterns
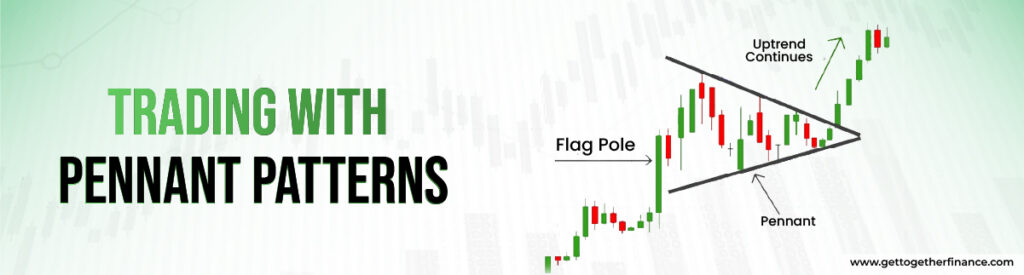
Now that you have learned about pennant patterns and how to identify it so far. It’s time to know how you can enter this trade and make the best out of this opportunity:
Spot the Pennant Pattern
- First, look for a big price move, which creates the “flagpole.”
- Then, watch for the price to consolidate into a small triangle shape, known as the “pennant.”
Entry Points
Buy Entry: If the pennant forms after an uptrend, wait for the price to break out above the upper part of the pennant. Consider buying when the price goes above this level, especially if it’s near your marked supply zone.
Sell Entry: If the pennant forms after a downtrend, wait for the price to break below the lower part of the pennant. Consider selling when the price drops below this level, especially if it’s near the demand zone.
Exit Points
Take Profit (Buy Position): It’s best to plan to sell when the price gets close to a level where it might face resistance, such as the supply zone or another key resistance level above the pennant. Keep your exit point just below the marked exceptional zone to book the profit before more sellers enter the market.
Take Profit (Sell Position): Plan to buy back when the price nears a level where it might find support, like the demand zone or another key support level below the pennant.
Risk Management
Since these technical analysis chart pattern often lead traders to fake breakouts, experts believe to club with other fundamental technical analysis concepts such as demand-supply dynamics. The theory is easy, based on science of business and physics. Once you learn the basics (can access full course on YouTube), here is how you can protect your trades from major downfalls:
Find Demand and Supply Zones
Mark the best, exceptional supply and demand zone to check the strength of pattern and possibility of continuation. Follow the below steps:
- Mark Demand Zone: For a pennant pattern, locate the strong demand zone, usually below the pennant. This is where buyers might step in if the price drops.
- Mark Supply Zone. Mark the key, exceptional supply zone, usually above the pennant. This is where sellers might act if the price rises.
- Stop-Loss Orders: Place stop-loss orders just outside the pennant pattern. For a buy trade, put the stop-loss slightly below the lower part of the pennant. For a sell trade, put it slightly above the upper part of the pennant.
Using demand and supply zones with pennant patterns helps you decide when to buy or sell, manage risks, and improve your trading strategy. You can easily learn these theory for free with its YouTube channel. However, clubbing two profound theories can help a robust trading setup.
Difference Between Pennant Patterns and Triangle Patterns

Pennant patterns start with a big price move, which gives an impression like a flagpole. However, there is a fine difference between both pennant and flag formation. Let’s take a look:
| Aspect | Pennant Patterns | Triangle Patterns |
| Formation | Strong move (flagpole) followed by a small triangle (pennant). | Converging trendlines. Types: ascending, descending, symmetrical. |
| Duration | A few weeks to a couple of months. | A few weeks to several months. |
| Trend Context | Follows a strong trend, signals continuation. | Can signal continuation or reversal. |
| Shape | Small, symmetrical triangle. | Various shapes: flat top/bottom or symmetrical. |
| Breakout | Direction of the initial trend. | Depends on the triangle type and breakout direction. |
| Entry Signal | Buy above the pennant, sell below. | Buy/sell based on breakout and triangle type. |
In A Nutshell
In a wrap, pennant pattern is a handy tool for predicting price movements, but it’s not a foolproof method. It’s like a helpful guide that shows potential trends based on past price behavior. However, to make better trading decisions, you should use it with other methods such as demand-supply theory etc. So, while the Pennant formation is useful, it’s best used alongside other indicators to get more accurate and reliable trading signals.
FAQs
How long does a Pennant Pattern last?
It typically lasts from a few weeks to a couple of months.
What is the best time frame for trading Pennant formations?
Pennant formation can be found on various time frames, but they are commonly used on daily or weekly charts.
Can Pennant Patterns work in any market condition?
They work best in trending markets and may not be as effective in choppy or sideways markets.
Can Pennant Patterns signal a reversal?
Generally, they speak of continuation. If a pennant appears after a downtrend, the breakout upward could suggest a reversal, but it’s less common and is really rare.