What is the Rounding Bottom pattern?
- Updated on : March 27, 2026
- 4434 Views
- by Suhani

 Instagram
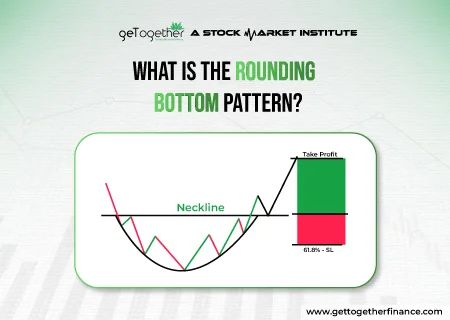
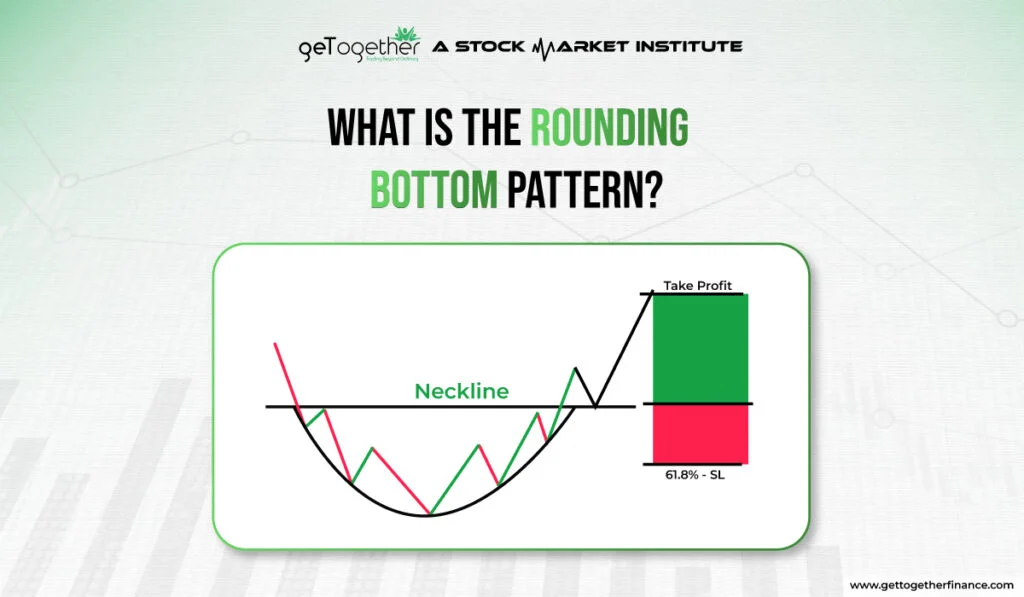
Rounding bottom is one of the conventional trading patterns that investors use in anticipating bullish market movements. This pattern helps in understanding that a gradual shift in price is coming from a downtrend to an uptrend. It is used as a bullish pattern in technical analysis by conventional traders. When the market is falling and on the verge of recovery, the rounding bottom pattern gives an idea that reversal may be near. It resembles a cup-like shape with a curved bottom made of a consolidation of candlesticks. Further, the candlesticks chart showing an upward direction, indicates a reversal. In the following sections, we’ll dive deeper into how to identify and interpret this pattern, along with practical strategies for trading success.
Identifying the Pattern

Rounding bottom top can be identified with certain characteristics and key components:
Formation Components:
Low points: The lower lows are formed in the downtrend, indicating heavy selling in stock or security.
Rounded bottom: As sellers start losing momentum, the price starts consolidating, making a rounded bottom, this shows that a support area has been formed, which can eventually give a reversal.
Breakout Confirmation: The downtrend starts from a certain resistance point, when the uptrend that comes after making rounded bottom breaks the resistance form where the downtrend started, traders take it as a confirmation of pattern completion. Here the long positions can be taken by considering the alignment of all other technical factors.
Volume surge: The breakout should be supported by the surge in buying volume, making it a strong long trade.
Characteristics:
Gradual shift: The gradual shift from downtrend to uptrend can be seen in the rounding bottom pattern.
Rounded shape: The pattern resembles a wide-shaped “U” with a curve starting from the downtrend and ending at the uptrend.
Volume decline: The pattern is formed during the downtrend, when the consolidation occurs, the selling volume typically decreases, indicating that buyers are overpowering them.
Symmetry: The pattern often shows symmetrical movement in both downtrend and uptrend, making it easy to spot.
Identifying these characteristics and key components is crucial for traders to effectively recognize and capitalize on the Rounding Bottom Pattern’s potential bullish reversal signal.
Interpretation and Significance

Bullish Reversal Signal:
The rounding bottom pattern can be interpreted as a good bullish reversal signal in the technical analysis. After a strong downtrend, when the price starts consolidating and forms a curved shape at the support area, it indicates the exhaustion of the sellers. As prices begin to curve upwards, it can be interpreted as that buyers are gaining momentum and a surge in price may come. When the uptrend goes till the resistance level formed by the downtrend of the pattern, and easily breaks it, it can be taken as a breakout point indicating that the uptrend will continue. This breakout should be accompanied by an increase in trading volume, further confirming the reversal signal. Traders who take this pattern as an add-on to their advanced technical analysis early can position themselves to capitalize on the potential uptrend in the price, potentially leading to a good long opportunity.
Price Action Insights
Apart from signaling a bullish reversal, the Rounding Bottom Pattern provides valuable insights into price action dynamics indicating a good buyer and seller fight. The gradual formation of the rounded bottom with consolidation shows a transition phase in market sentiment, where the buyers take away the selling pressure, sifting the market sentiments from pessimistic to optimistic.
The pattern is extremely symmetrical, indicating a balanced fight between buyers and sellers, with neither side exerting significant dominance unless the breakout comes at the resistance. Additionally, the decrease in the trading volume of sellers during the Rounding Bottom formation indicates a decrease in selling pressure, potentially indicating that sellers are getting exhausted and booking profits in short trades.
These price action dynamics can help in gauging the strength and sustainability of a bullish reversal pattern. Moreover, by combining the Rounding Bottom Pattern with other technical indicators or chart patterns, traders can enhance their confidence in their trading decisions and better navigate the intricacies of the market.
Tips for Trading with Rounding Bottom Pattern

Entry and Exit Strategies:
Entry: Take entry at the resistance level where the uptrend breaks the corresponding level of downtrend.
Confirmation: Wait for the confirmation entry till the breakout comes after breaking the resistance level. It is advisable to not take entry before that and also to surge in volume before taking entry.
Pullbacks: Use minor pullbacks after the breakout as potential entry points, aiming to capitalize on favorable risk-reward ratios.
Stop-loss: Place the stop-loss at the lowest point of the rounding bottom.
Risk Management:
Position Sizing: Determine the position of the trade based on your risk tolerance and capital available in your account.
Stop-loss Orders: Do not trade without a stop loss, always protect your money in case the trade goes in an unfavorable direction.
Diversification: Avoid putting all your money into a single trade and make sure you only risk 1% of your capital.
Risk-Reward Ratio: Assess the risk-reward ratio before entering a trade, and aim for favorable and realistic targets.
By adhering to these entry and exit strategies and implementing robust risk management practices, traders can effectively navigate the Rounding Bottom Pattern and increase their chances of trading success.
Limitations
The Rounding Bottom Pattern, while a valuable add-on in technical analysis, has limitations. These include:
False Signals: Not all rounding bottom patterns turn into bullish reversals, many are false signals too.
Subjectivity: The shape is hard to identify, not always the round bottom is curved and symmetrical, many other factors need to be considered.
Time Frame Dependence: The round bottom patterns’ may vary across different time frames, potentially leading to a huge confusion in the trader’s mind about what time frame to consider.
Market Volatility: High volatility can distort the pattern formation, making it challenging for the traders to find the accuracy in the pattern and to trade accordingly.
Conjunction with Demand and Supply
Round bottom pattern alone is never enough to trade. It can be taken as an add-on to advanced technical analysis. For example, you can use demand and supply theory and see whether a strong strong demand zone is coinciding with the rounding bottom pattern. If the rounding bottom pattern is running from a strong demand zone, then it makes it a high-probability trade setup with major chances of bullish reversal. Follwingly if the surge in volume is there, then the trade setup can be considered strong. This way, you should only take the rounding bottom pattern as an add-on and not the independent trade indicator.
At Last
Finally, the Rounding Bottom Pattern is a useful tool for traders since it predicts probable positive market reversals. Understanding its characteristics and important components allows traders to spot opportunities to enter long positions and profit from upward price movements. However, it is critical to understand its limits, such as misleading signals and subjectivity in identification. Traders can improve their trading decisions and better traverse the market’s intricacies by using risk management tactics and other technical analysis tools. Remember that the Rounding Bottom Pattern is only one piece of the puzzle, and it must be used in concert with other indicators to provide thorough information and make informed trading decisions.
FAQs
What is a Rounding Bottom Pattern?
A rounding bottom pattern, also known as a saucer bottom, is a long-term chart pattern that indicates a possible turnaround from a downtrend to an uptrend. It resembles a bowl or saucer and represents a steady shift in market sentiment from negative to positive.
How do I identify a Rounding Bottom Pattern?
To detect a Rounding Bottom Pattern, look for a long-term downturn followed by a progressive flattening of the price decrease, resulting in a round or U-shaped bottom. The pattern is confirmed when prices break above the resistance level created by the pattern’s high points.
What does a Rounding Bottom Pattern indicate in trading?
A rounding bottom pattern implies a shift in market sentiment from negative to positive. It implies that selling pressure has progressively diminished and buyers are gaining control, potentially resulting in a lengthy rally. Traders often interpret this pattern as a bullish signal for buying opportunities.
What are the limitations of the Rounding Bottom Pattern?
Limitations include misleading signals caused by market noise or protracted consolidation periods. Furthermore, the pattern’s long-term nature may necessitate patience, and its efficiency will vary depending on market conditions. To increase dependability, traders should check the pattern using other technical indicators or research tools.
How can I use the Rounding Bottom Pattern in conjunction with other strategies?
Combine the Rounding Bottom Pattern with additional technical indicators or research tools to improve your trading selections. To boost dependability, confirm the pattern with volume analysis, momentum oscillators, or trendline breakouts. Consider fundamental analysis and market environment when developing a complete trading strategy.


