Sideways Market: Characteristics, Strategies, and Trading Tips
- December 6, 2024
- 2391 Views
- by Manaswi Agarwal


In the world of financial markets or trading, you must have heard someone saying “today’s market was trending”, “there was not much movement in the market today”. Both the situations describe the trend of the market for that particular trading session. When the market shows a trend, it can be either bullish or bearish, in the other case, the market is sideways.
Table of Contents
ToggleWhat is Sideways Market?

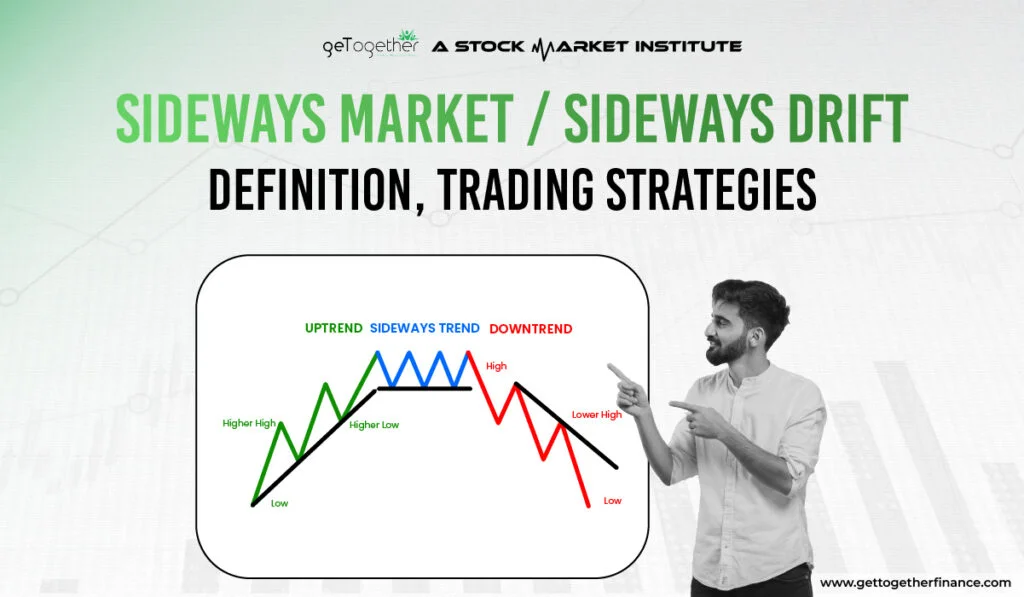
A sideways market is a phenomenon that takes place when the prices of securities fluctuate between a fixed range for an extended period. The price follows a sideways trend where the range of a security is fixed which it cannot break. Basically, this is described by a move which falls in between the support and resistance levels within which the price oscillates.
Sideways market impacts traders psychologically as it can be quite confusing and frustrating as the market lacks to give a move in a single direction. In a trending market, the prices tend to follow a single direction either upwards or downwards. The price continues to move in the trend by breaking small support or resistance levels, however, for an extended period it moves in a single direction.
Understanding Sideways Market

The prices during the sideways market or often referred as horizontal market remains in the same range showing little or no significant changes over a period. It indicates the balance of buyers and sellers in the market and signifies that none of them is able to push the prices in a single direction. Let’s determine how you can identify a sideways trending market:
Limited Price Movement
When you find the prices in a security to be fluctuating within a narrow range, a sideways trend in the market is ascertained. The price oscillates between the support and resistance level without giving a bullish or a bearish trend.
Indecisiveness
When the prices move in a narrow range, it signifies indecisiveness in the market as buyers and sellers are maintaining a balance which reflects uncertainty among investors.
Low Trading Volume
To be in a single direction, high volume is required to move the prices in either way. However, in a sideways market, the trading volume is very low as many investors prefer directional markets which reduce their participation in low trading volume securities.
Duration
A sideways market or consolidation period in a security can last from a few weeks to several months or even longer. It actually depends on various other external factors that drive the price movements in a security.
Technical Indicators to Navigate Sideways Market

To effectively understand the occurrence of a sideways market, usage of technical tools with price and volume can prove to be useful for investors.
Moving Averages
Moving averages calculates the average of opening and closing prices over the past few days. It is represented on the charts with a single line which makes it easier for traders to identify the sideways drift in the market. The price tends to roll up and down on the moving average during sideways market, the moment price starts to support or resist the EMA support, it moves in either direction.
Bollinger Bands
Bollinger bands are the technical tools used to identify price volatility and market dynamics which helps to visually examine if the security is overbought or oversold.
Relative Strength Index (RSI)
Relative Strength Index is a technical momentum indicator used to measure the magnitude of recent price changes which analyzes overbought or oversold conditions in the security. Traders can determine potential trading opportunities with the help of the index.
How to trade in the Sideways Market?

To trade in the sideways market, strong and reliable technical strategies are required to be implemented while navigating the potential of the sideways market.
Observe the Price Movements
To trade in a sideways market, firstly closely recognize the fluctuating market conditions as it is very challenging for traders to generate quick profits. Due to the uncertainty in the direction of prices, opt for a more cautious approach without taking excessive risks and observe the market in the consolidation phase.
Breakout Point / Break Even Mode
Recognize for the breakout points through increased volume in the security to gain maximum returns. In fact, try to minimize the losses by maintaining break even points. With the help of this, you can actively manage your trades as well as reduce losses.
Stop- Loss Order
The stop loss orders are placed exceeding the support and resistance levels. If the prices break the given narrow range, it is expected to give a breakout in either direction.
Well, for advanced trading strategies in the sideways market, you can surely refer to Investment part 2 video from Trading in the Zone 2.O which explains the concept with breakout trading strategies in the easiest manner.
Benefits of Trading in Sideways Market

Traders who want to bet on the safer side can make certain profits by picking frequent trading opportunities. Here are the benefits of trading in sideways markets:
Strategic Trading Opportunities
As the price moves in a fixed range, traders can capitalize on this predictability using technical indicators in the sideways market enabling traders to spot potential entry and exit points.
Reduced Volatility
During a sideways trend in the market, there are not many swings in the prices as it exhibits lower volatility compared to active trending markets.
Limitations of Trading in Sideways Market

Trading in the sideways market is subject to various drawbacks wherein it is important to understand the market in depth with the correct technical analysis approach.
High Transaction Costs
Trading during the consolidation phase offers more trading opportunities as the price moves within a defined range and can buy at support as well as sell at the resistance point. Due to frequent trading, traders have to bear high transaction costs.
Time Consuming
Trading actively to capitalize the sideways market is very time consuming. A trader would require to regularly monitor the trade by keeping well defined entry and exit points to ensure correct execution.
The Final Thought
Sideways Market or consolidation phase in the security describes a narrow range where the price consolidates for an extended period between the support and resistance levels. To approach the sideways, it is best recommended to opt demand and supply theory. You can learn the theory from GTFs Trading In the Zone course available for free on YouTube.
FAQs
What is a Sideways Market or Sideways trend?
A sideways market or trend in the security represents the consolidation phase where the prices of an asset roam around a narrow range without any significant price movements.
How to detect a sideways market?
You can make use of moving averages to correctly detect the sideways market. Observe if the price is moving between the support and resistance levels within a narrow range to look for a sideways trend in the market.
How to trade in the sideways market?
To trade in the sideways market or sideways, follow demand and supply theory which helps you to find out the breakout in prices after the end of consolidation phase.


 Instagram
