Understanding Stock Market Volatility


Table of Contents
ToggleOverview
Stock market volatility carries both exceptional risks and rewards. In high volatile markets, numbers make dramatic movements, whether it is an uptrend or downtrend.
Many might believe that volatility sets the winds, moods, and direction of the market.
The statement holds no truth!
Volatility does not change the mood or direction of the market, rather helps a trader in finding the perfect trading strategy to swim in the market waves.
But how does the concept work, how is it calculated, and what factors drive stock price volatility?
Let’s begin with the basics first.
What is Volatility?

Known as the heart of the finance world, volatility helps gauge the quick fluctuations of share price.
In simpler terms, it is the rate at which the stock or market price goes up or down over a specific period of time.
Some people assume the volatility is closely connected with the bearish market. However, the term on the contrary, focuses on constant ups and downs in the market and measures the rate of shift in the market moods.
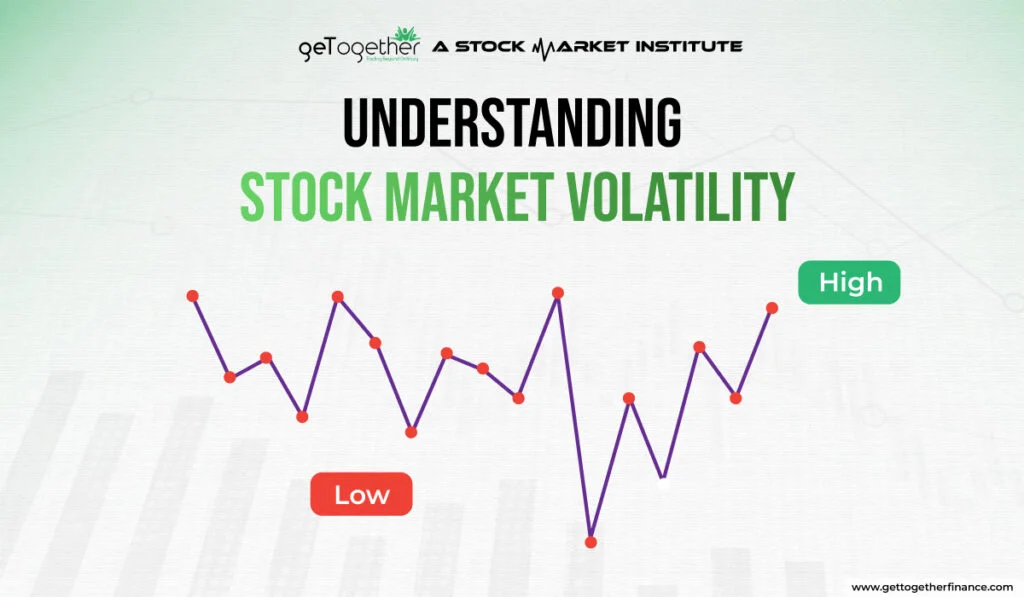
- If the stock market volatility is high that means higher risks of entering the market as the number of active traders (buyers or sellers) have overflowed.
- On the flip side, if the volatility is low, the price doesn’t move or change much, rather maintain a steady speed in either direction.
Although there are advanced tools or software to measure stock market volatility, the traditional way to gauge this is either using standard deviation or calculating the variance between returns from the specific index or stock.
Let’s get into some technicalities for understanding volatility concepts a little deeper.
Understanding Volatility

The term ‘volatility’ comes from ‘volare’, a Latin verb that means ’to fly’. Hence, the term represents the significant jump in the price, whether upward or downward.
The concept was introduced widely in the picture in 1952 by Harry Markowitz, a young economic graduate at the University of Chicago with his remarkable study titled, “Portfolio Selection”. The paper argued and suggested that performance of a stock should be judged on the basis of the amount of risk it takes.
Since the definition of risk can vary, depending on the circumstance and situation, Markowitz used ‘variance’ or ‘volatility’ as the main tool to measure the risks. For instance, bonds are often less volatile than stocks, hence investors expect better returns from trading in securities.
The publication won a Nobel prize in 1990 and was added as an academic model that helps investors calculate the trade-off between return and risk.
Stock Market Volatility often measures the number of active traders in the market and the dynamic of market sentiments. This signifies the risk or uncertainty in the price fluctuation of securities of indices. A higher volatility means more sellers or buyers entered the market, increasing the probability of substantial change in the price over a short period of time. Whereas a lower volatility means the market is steady with stable active traders. This leads to calm in the market situation, ensuring traders that the value of security does not change dramatically.
Although the variance includes the difference in return, in general, volatility speaks the same variance, but within a defined period of time. Hence, one can measure the daily, weekly, monthly, or annual volatility to understand the market circumstance, active traders, and potential price shift within the stock market.
Also Read: Implied Volatility
Types of Stock Market Volatility
When it comes to types, volatility is segregated into four parts – historical, local, stochastic, and implied volatility. Both of these are important to analyze and give in-depth insights to traders, helping them make more informed decisions. Let’s delve into this without further ado:
Historical Volatility

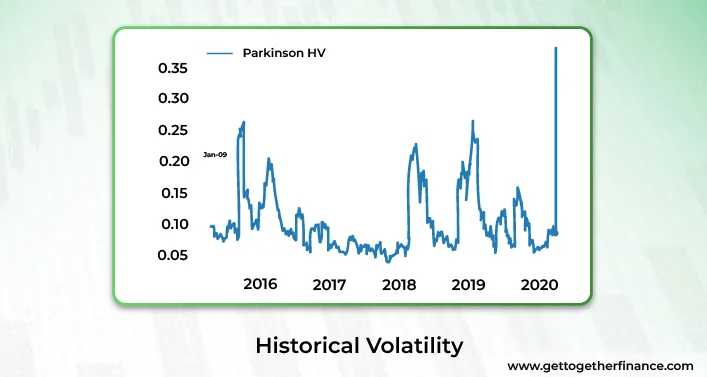
Historical volatility studies the previous price movement of a stock or index to understand the risk pattern and behavior. The concept gives a retrospective look at the changes of underlying asset’s price in the past over a specific time period.
Historical volatility often gives a quantitative view of past market behavior and is typically measured using variance or standard deviation method. It is considered one of the useful tools to anticipate the behavior of price movement, however it is evident that history doesn’t repeat itself, hence the result might not always be the same.
Implied Volatility

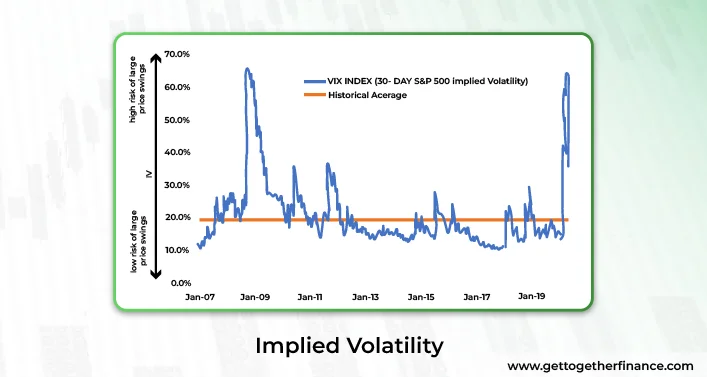
Among all, implied volatility, also known as IV, is a forward-looking measure that shows marked expectations on the changes of price. Just like a collective guess about the future swings of price. Often used in options and other derivatives i.e. related to an asset, implied volatility studies the number of active traders (demand and supply) and market sentiment (calm or panic) to understand the significant shift in the price and anticipate the next price movement.
Another concept i.e. closely related with IV is local volatility. The concept of local volatility is popular majorly in the derivative market. The idea behind this is to measure the volatility of assets at a specific point of price and time. Used for quantitative analysis, the concept is closely related to IV (implied volatility). Introduced by Iran Kani and Emanuel Herman, LV is mostly used in options to calculate the actual option’s volatility across a range of expirations and strike price.
Since local volatility is seen as a range of IV, this is decoded as sensitive to changes in implied volatility. A small change in IV can hugely bring drastic shifts in LV.
How is Volatility Calculated?

Aforesaid, a common way to measure stock market volatility is to get the standard deviation of price fluctuations over a specific time period. The calculation allows you to find out the difference of numbers from an average value.
What’s left is another important aspect, which is variance. But what is the formula?
vol = σ√T
In detail:
Volatility = standard deviation of returns ✕ √number of periods in time horizon.
Standard deviations are crucial as they not only reveal how much value may change but also offers a system for the odds it will occur.
Remember, the higher the standard deviation, the higher the rate of movement of the portfolio in either direction.
Example of Volatility
No education is complete without an example. So let’s assume that you want to measure the volatility of a stock over the past five days.
Step 1: Gather Data
List down the closing price of the stock in the last five days. the closing prices of the stock for the past five days.
Day 1: ₹100
Day 2: ₹105
Day 3: ₹98
Day 4: ₹102
Day 5: ₹100
Step 2: Calculate Daily Returns
Find out the daily return by measuring the difference in closing price each day, relative to its previous day close. For example, if the first day closing is ₹100 and second day closing is ₹105, the daily return is estimated at 5%.
Step 3: Calculate Average Daily Return
Find out the average of daily returns to make a pattern in price fluctuations. Add all the daily returns and divide the sum by the number of days. It will help you average your daily return.
Step 4: Calculate Volatility
Calculate the variance of the daily returns. This tells you how much the stock price is changing each day. The higher the variance, the more volatile the stock is.
To get the volatility, take the square root of the variance. This gives you a measure of how much the stock price is likely to change in the future based on its past performance.
Causes of Volatility

Although one of the primary, logical reasons behind stock market volatility is dramatic increase in the number of active traders (buyers or sellers). Depending on the surprising events, investor sentiment, or economic certainty, the investors get hyper active in the market, losing the calm. It is the panic or market stress situations where more buyers or sellers enter the market and dominate either buying or selling.
Here are list of potential causes, beyond general ebb and flow of the market:
- Geopolitical risks and global events such as terrorism, wars, or tensions between countries.
- Political risks such as elections or change of government policies often affect the stock market and business environment.
- Economic development or release of economical reports can cause panic situations, spurring the volatility. For example, consumer price, manufacturing activity, job numbers, etc.
- Bad headlines of major players impinge the overall market, causing stress. Best corporate scandal example is the Hindenburg Research report on Adani Group.
- When a country announces new or updated central bank policies, it can prompt stock market volatility. For instance, RBI usage on credit card 2024.
- Natural disasters like wildfires, hurricanes, earthquakes are affecting global markets or stock market events.
Above are listed alarming events that can majorly lead to stock market panic. During the time of high volatility, the prices take major swings, in either direction, depending on the type of event or news.
How to Manage Volatility

As they say, the turbulence tempts you to make whimsical decisions, making the strongest one doubt oneself. During volatile times increase the urge to take actions, whether buying or selling, but in reality, this is the time to review your strategy and trust your place. Such times will test your true risk tolerance and check on your investment strategies.
Best way to face the volatile market is investing in a long-term strategy. Some investors get influenced by slight turbulence due to greed or fear. But as the stock market echoes that growth of the market is inevitable in the long run. The trick is to stay calm in the panic and add more with every dip. Another way to stay safe in the volatile market is owning a diversified portfolio. For example, if your portfolio includes the metal sector, PSU banks, and auto sector. Now due to major global events, the auto sector takes a deep dip, you can still enjoy a green portfolio with other shares you strategically picked.
Some investors suggest hedging during the volatile markets, such as trading options puts or future puts to average their losses without having to sell your shares. A trader might get lost after seeing the market turn red but wise investors believe in transforming risks into opportunities. A little tip – short-term price dip may offer long-term opportunities.
In A Nutshell
It is completely okay to be concerned by periods of stock market volatility. It is one of the most interesting, valuable, yet scary phases of the market which might make or break your investment, if you choose to enter the market. While this seems tempting to give in to this fear, experts recommend learning technicalities of the stock market and preparing robust risk management and trading strategy to enter and book profit.
FAQs
How much market volatility is normal?
Volatility is inevitable for investors and markets frequently face heightened volatility. As per the observation, in a year, one should plan on seeing average 15% of volatility and 30% drip in once every five years. This is the average volatility and an investor should be able to stomach this if entering the equity market. In general, a bullish market is related with low volatility and a bearish market is calculated with unpredictable price swings, typically found downward.
What is the VIX?
VIX, or the fear index, is one of the most common ways to measure stock market volatility. It measures the expectations of investors and sentiment of the market on the specific stock or market indices. Often VIX aims to measure how much traders expect mood swings in Su0026amp;P 500 prices in the upcoming month.
What is volatility?
Volatility, in simpler terms, is a rate on which the price fluctuation in the stock or market index occurs. This measures the key factors such as market sentiments (calm/panic), active traders, historical price average, trading volume, liquidity, global factors, etc. to gauge the volatility rate and anticipate the price swings in either direction. Volatility doesn’t claim to identify the potential market direction but helps figure out the potential price behavior.
Is volatility the same as risk?
Volatility often goes with another name, ‘risk’ in the market. However, both have no correlation. According to expert traders, volatility only speaks of significant price movement or signifies stable market vibe. If traded with a strong trading set-up along with good risk management, one can enjoy the high peaks of market waves, despite the direction.
Is volatility good or bad?
There is no good or bad in the stock market as the one who learned the tricks to dive deeper knows how to play with every tide. If you’re a trader with a good strategy and strong risk appetite, it might change the way you see things. For instance, long-term market investors might see it as a bad omen but short-term traders, option traders, or day traders, this is like a pool of opportunities.


 Facebook
 Instagram
 Youtube
