Symmetrical Triangle Pattern: What it is and How It Works?
- May 3, 2024
- 3014 Views
- by Arun Singh Tanwar

 Facebook
  Instagram
  Youtube
The Indian Stock Markets have become one of the most sought-after destinations for investment globally. Everyone wants to benefit from the Indian growth story by investing in stocks. But, stock markets carry high risk. Hence, it is important to analyze the stocks before investing.
There are 2 popular types of analysis tools used by investors namely, fundamental analysis & technical analysis.
- Fundamental Analysis: Using the financial statements, key business ratios, industry & economic situation, etc. to make investment decisions.
- Technical Analysis: Studying chart patterns to identify trends to gain from stock trading.
Technical analysis is mostly used to make short-term investment decisions. One of the important technical indicators is the symmetrical triangle pattern. This blog covers the ins and outs of this pattern thoroughly.
What Is a Symmetrical Triangle Pattern?
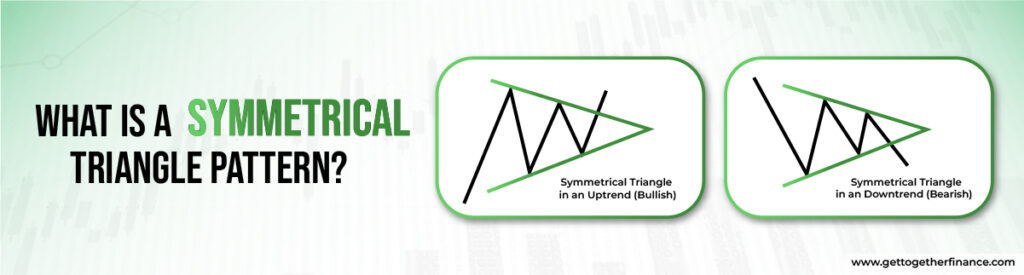
When the price of a stock creates a sequence of lower highs & higher lows such that two straight trend lines drawn through the lows & the highs converge at a point, it is called a symmetrical triangle pattern.
The above image illustrates how the trendlines drawn through the highs and lows of the chart are converging to form a triangle.
How does a Symmetrical Triangle Pattern work?
A triangle pattern shows the buildup of a saturation point. At this stage, the buyers and sellers are equally positioned causing the price volatility to reduce. If a strong pattern is formed, traders expect a substantial symmetrical triangle pattern breakout.
A good trader would identify such opportunities and enter the trade at the right time to benefit from these sudden price movements. Let’s understand how you can identify and utilize this pattern to make profits.
Also Read: Market Peaks and Troughs
Understanding Symmetrical Triangle Pattern
To learn how a symmetrical triangle pattern works, you need to identify and understand the interpretation of such a formation on the chart. Here are the elements you need to see to interpret it:
- Identify Consolidation: Higher lows and lower highs suggest that the market is saturated. Hence, the stock price enters a consolidation phase of less price volatility and lower trade volumes. You need to identify this trend using the candlestick charts.
- Form trendlines: You should draw the trendlines on the chart by joining all the highs & all the lows to see whether both lines are converging.
- Anticipate the Breakout: An upward breakout shows bullish momentum and a downward breakout shows bearish momentum.
- Confirm the Breakout: Usually, a higher volume along with the breakout is sufficient evidence for the traders to confirm.
- Other Technical Indicators: It is a bad practice to follow only one indicator to make a decision. Hence, traders use other technical indicators along with the symmetrical triangle patterns to identify the trend.
- Risk Management: Stock markets are uncertain and even the biggest players are at the risk of making a wrong trade. So to avoid heavy losses, you should always use a stoploss.
- Duration of the Trend: The symmetrical triangle patterns can occur at various periods, such as daily, weekly, monthly, etc. However, such a formation is more powerful when occurring over a longer duration.
- Symmetrical Triangle Pattern Target: Once you have confirmed the breakout, you can decide on the target.
- Measure the gap between the widest part of the trendlines (shown by the green arrow in the graph below.
- Project this difference from the breakout point in the direction of the breakout to get the new target.
Types of Symmetrical Triangle Patterns
- Normal Symmetrical Triangle:
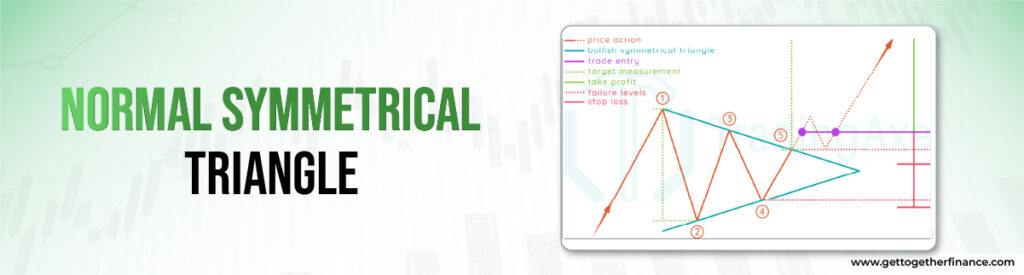
When the trendlines are drawn with similar slopes to each other, the pattern formed is called a Normal Symmetrical Triangle Patterns. As the trendlines converge, the volumes and volatility are highly reduced. This shows indecision in the price as neither buyers nor sellers are winning. You can see this in the image below.
- Higher lows & lower highs
- The trendlines connect at the apex
- Traders expect a breakout in any direction at this point
- An upward breakout is taken as bullish, and a downward breakout is taken as bearish
- As it is a neutral pattern, the traders analyze volumes to confirm the breakout
2. Ascending Symmetrical Triangle:
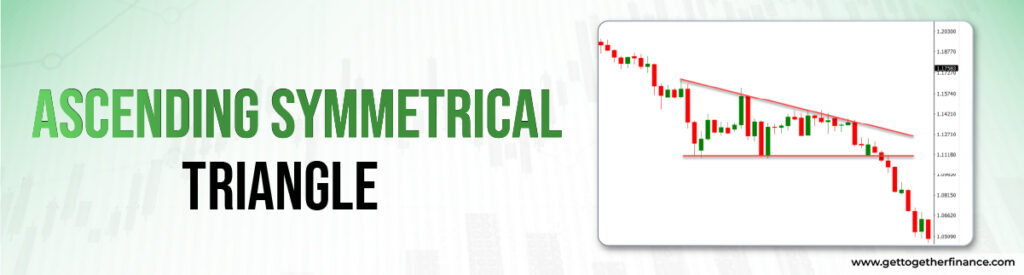
When the lower trendline slopes upwards and the higher trendline remains comparatively flat, it is called an Ascending Symmetrical Triangle Pattern, or a Flat top pattern. As you can see in the above image, it shows a bullish trend.
- Higher lows and comparatively equal highs
- The converging trendlines show the buyers gradually gaining an edge over the sellers creating a price indecision
- As this is considered a bullish formation, traders expect the price to rise sharply after the breakout, unless there is a bearish breakout
- Of course, the volume indicates the strength of the bullish momentum
3. Descending Symmetrical Triangle:
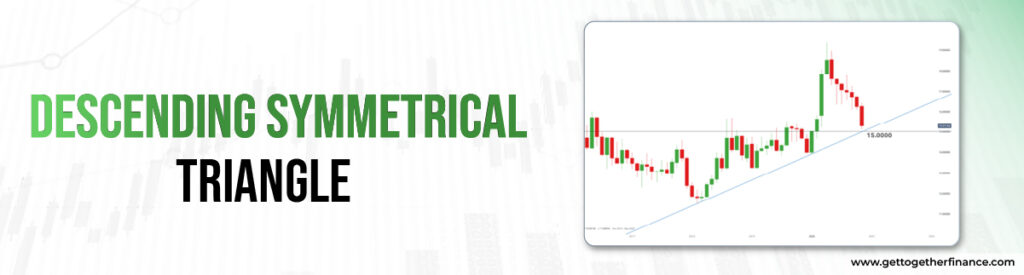
When the higher trendline slopes downwards and the lower trendline remains relatively flat, it is called a Descending Symmetrical Triangle Pattern, or a flat bottom pattern. As you can see in the above image, it shows a bearish trend.
- Lower highs and comparatively equal lows
- The converging trendlines show that the sellers are gradually gaining an edge over the buyers creating a price indecision
- As this is considered a bearish formation, traders expect the price to drop sharply after the breakout, unless there is a bullish breakout.
- Of course, the volume indicates the strength of the bearish momentum
Importance of Symmetrical Triangle Pattern in Technical Analysis

The importance of the Symmetrical Triangle Pattern in trading cannot be underestimated. Here’s how traders can benefit by identifying this pattern correctly.
- Identify Consolidations: By plotting the trendlines, you can identify whether prices are consolidating showing the formation of a symmetrical triangle patterns.
- Predict & Confirm Breakouts: Once you understand the pattern, it is possible to predict the price breakouts correctly. You can confirm the breakout by studying the changes in volumes.
- Price Targets: The maximum difference between the trendlines shows the potential price movement after the breakout. You can identify the entry, exit, target & stop loss levels by using the symmetrical triangle patterns.
Best Way to Trade Symmetrical Triangle Pattern
Once you have identified the pattern, you should monitor the chart closely and wait for the breakout. A strong symmetrical triangle pattern depends on the number of times the chart touches the trendlines on both sides.
Once you see the breakout and confirm it with the corresponding volume figures, you can identify the entry, target, exit & stop loss points to enter the symmetrical triangle patterns stocks. If you follow the risk management techniques properly, there is no chance of heavy losses.
Conclusion
A symmetrical triangle pattern is a technical analysis tool for identifying stock price consolidation. At this stage, volumes and volatility gradually reduce, causing price indecision. Hence, the stock price has the potential to break out.
By analyzing the charts correctly using the strategy discussed in this blog, you can start gaining from stock market trading.
FAQs
1. What is the significance of the symmetrical triangle pattern in trading?
The symmetrical triangle pattern shows price consolidation in the market, causing potential breakouts. By studying the price charts, you can identify entry and exit points and set price targets. Its versatility across timeframes makes it valuable for traders in identifying opportunities and managing risk.
2. How can I identify a symmetrical triangle pattern on a price chart?
To identify a symmetrical triangle pattern on a price chart:
Draw 2 trendlines through the highs and lows of the chart
If the trendlines converge to join at a point forming a triangle, it shows the symmetrical triangle patterns
If at least two peaks or troughs touch on each trendline, it is a strong pattern
As the pattern progresses, volatility decreases, indicating consolidation in the market.
3. Are there specific considerations for trading volume when dealing with a symmetrical triangle pattern?
Yes, once there is a symmetrical triangle pattern and you identify it, the next step is to identify the breakout. Trading volume can confirm the breakout. High volume suggests strong market participation, enhancing the reliability of the breakout signal.
4. Can you explain the characteristics that define a symmetrical triangle pattern?
Here are the key characteristics of a symmetrical triangle pattern:
A series of lower highs and higher lows
Converging trendlines with similar slopes
Low volatility and lower volumes indicate consolidation
Traders anticipate a breakout in either direction
Higher volumes after the breakout confirm it
5. In terms of technical analysis, what role does a symmetrical triangle pattern play?
A symmetrical triangle pattern indicates stock price consolidation, indicating a pause in the current trend. It helps traders anticipate potential breakouts and provides new price targets. Confirmation with volume strengthens the validity of the breakout, guiding trading decisions.
6. How is the breakout direction determined in a symmetrical triangle patterns?
The breakout direction in a symmetrical triangle patterns is determined by the direction in which the price moves beyond the upper or lower trendline. A breakout above the upper trendline suggests bullish momentum, while a breakout below the lower trendline indicates bearish momentum.
7. Are symmetrical triangle patterns applicable in different timeframes?
Yes, symmetrical triangle patterns are applicable across various timeframes. You can apply them for intraday, and even longer-term charts like daily, weekly, or monthly. Thus, traders can have the versatility to trade in the timeframe they are comfortable with.
8. What are some common comparisons made between symmetrical triangle and other chart patterns?
Symmetrical triangle are often compared to other chart patterns like pennants and ascending and descending triangles. While ascending & descending triangles are consolidation patterns, pennants are continuation patterns.
9. How do traders typically set price targets when dealing with a symmetrical triangle patterns?
Symmetrical triangle pattern targets are set by measuring the height of the triangle at its widest point. This height is added to the breakout level for bullish breakouts or subtracted from the breakout level for bearish breakouts.
10. Is there a risk of false signals associated with symmetrical triangle?
Yes, there is a risk of false signals associated with symmetrical triangle. You might see breakouts that are not sustained. Hence, traders treat the breakouts without good volumes as false signals. A breakout accompanied by high volume is taken as a confirmation of the trend.