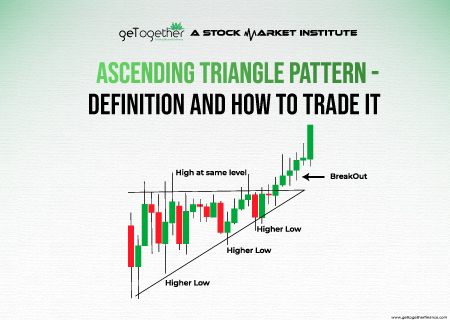
The ascending triangle pattern is a popular chart pattern used in technical analysis to identify potential bullish breakouts in the market. Traders and investors often use this pattern to make…
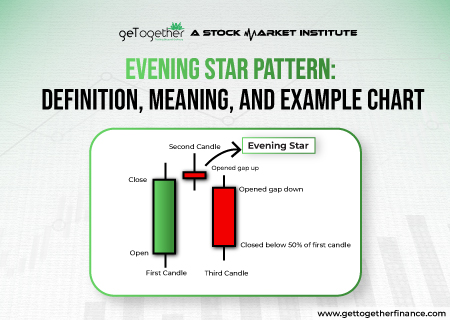
In the ever-shifting tides of stock markets, where success hinges on astute analysis and timely decision-making, candlestick patterns are an instrumental financial tool for traders and analysts alike. Among these,…
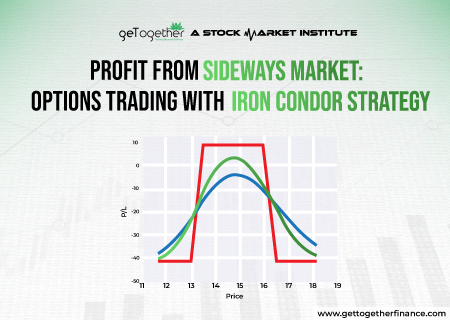
Most stock market traders buy/sell options contracts, hoping a particular stock’s price will rise or fall. Unfortunately, this happens frequently, and the price barely moves. The stock market’s unpredictability can…
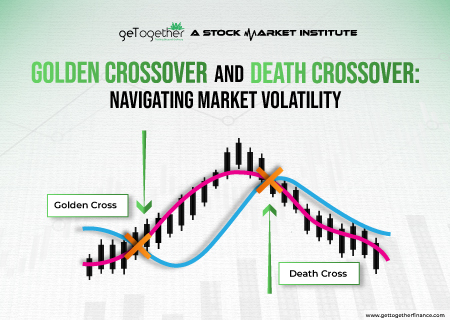
Overview Did you know that in the world of finance, two simple terms – the “Golden Crossover” and the “Death Crossover” – can either make or break your investments? It…
When the stock market is on an upswing, investors and traders often get overly enthusiastic. Their hyper-optimism pushes the market to new heights until it reaches saturation, where the trend…
A hammer candlestick pattern is formed when the body of the candle is formed upwards with a negligible upper wick; leaving the candle with only a lower wick. The significance…


 Facebook
  Instagram
  Youtube