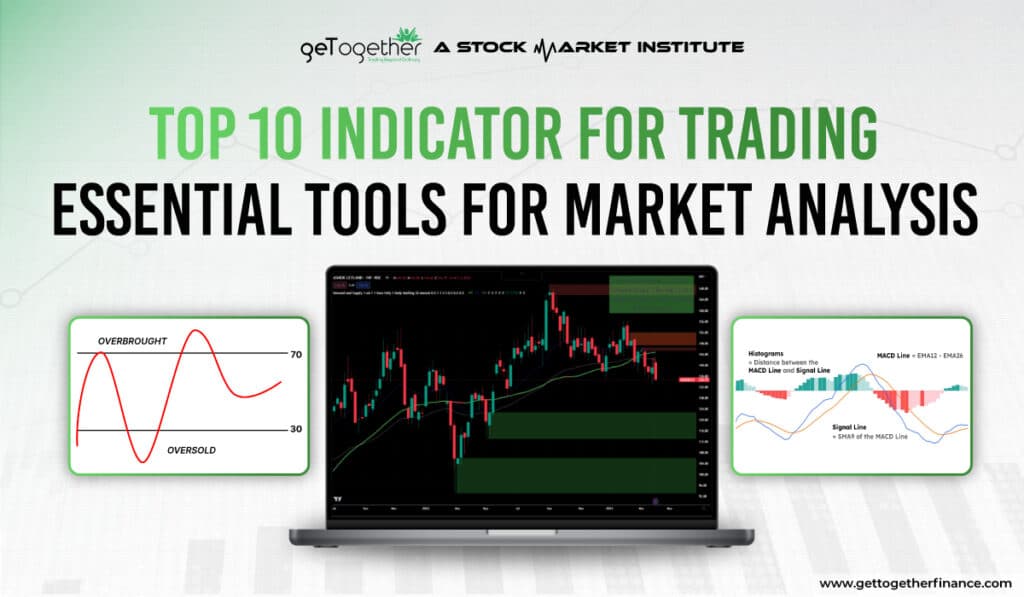
Top 10 Indicator for Trading: Essential Tools for Market Analysis
- April 17, 2025
- 1006 Views
- by Suhani

 Instagram
Overview
The key to Investing is buying and holding an asset for a long term. But waiting for years to see returns can feel like a lifetime, especially when you’re eager to reap the benefits of your efforts.
Trading, on the other hand, offers all the money-curious people an opportunity and a faster route to grow their wealth, however it comes with certain risks. Risks like market volatility can shake even the most seasoned traders, turning even the strongest trade setups nothing more than a house of cards.
Hence, to arm themselves with the knowledge of shifting market sentiment and fine-tune their trading strategies, traders use various technical indicators, hoping to keep up with market moods.
In this blog, we will discuss the top 10 indicators for trading that can improve your trading experience, making it more efficient yet seamless.
Top 10 Indicators for Trading
There are no technical theories, concepts, or indicators in the market that speak of the market with 100% accuracy. This is why most traders believe in combining fundamental and technical analysis while using technical indicators to capture even the smallest shifts in momentum, protect their trades, and secure profits.
Technical indicators work like a charm, they don’t do all the work, but they quickly pick up and highlight the story of what just happened in the market to traders with its quick reflexes. So we have combined a list of top 10 indicators for trading which you can use to enhance trading experience and confidence in the market.
1. GTF Indicator – The All-In-One Trading Tool
There is no indicator that predicts the market perfectly, but there is one indicator that has proven quite effective with its versatile feature, making it a perfect choice for traders and scalpers. The GTF Indicator is a cutting-edge tool exclusively designed to help traders spot exceptional demand and supply zones on TradingView charts with ease, efficiency, and accuracy.
It is simple to use and gives clear signals by combining multiple strategies. Instead of focusing only on volume or price, it looks at market trends, momentum, and direction. Plus, it provides easy-to-read levels for entering, exiting, and setting stop losses.
What Midday news said: Why GTF Indicator is the best choice for part-time traders?
Key Features of the GTF Indicator:
These features are not a boast but a rundown of a handy, on-the-go technical indicator for trading designed for scalpers and intraday traders. Let’s see what makes it a good choice:
- Spot Demand-Supply Zones:
This tool makes the job of finding the exceptional demand and supply zones a piece of cake, giving traders quick hints on where to enter and exit a trade. - Trend Detection (SMA50):
Trend decides your approach to see the market and it is quite a vital part. The GTF indicator includes built-in trend detection using SMA50 and shows it on the top of the chart. So if you’re up for a trade, the first thing you see is where the market is heading next. - In-Built Moving Averages (EMA20, EMA50, DMA200):
One of the quite interesting features of the GTF Indicator is its built-in feature that shows EMA20, EMA50 and DMA200. It gives traders added confirmation on market trends and improves trade accuracy. - Body-to-Wick and Wick-to-Wick Marking: Finding the right marking can be a time-consuming task, especially if you’re a trader. Hence GTF Indicator allows traders easily mark body-to-wick and wick-to-wick price action, saving you more time.
- Golden/Death Crossover Detection: Another advanced feature of the GTF Indicator is its key focus on automatically detecting Golden/Death crossovers so you can be notified early on reversals.
- Automatic Historical Zone Detection: Knowing the importance of historical walk of a security, this technical indicator aims to automatically find previous demand and supply zones. This helps traders in reading price’s past behaviour.
- Boring Candles Identification: The tool beyond just finding zones, helps in spotting “boring candles,” with little to no price movement.
- Volume Analysis & Live Data: Covering the key aspects of trading – volume, GTF Indicator gives info of live candle’s volume. Not just it, it helps compare it with previous candles, showcasing the strength of the market.
2. RSI (Relative Strength Index) – Market Momentum Tracker
RSI is also one of the widely used momentum index that gives traders great information on whether an asset is oversold or overbought. How? The index hints at the strong volume of price shift within a time frame and designates a number ranging from 0 to 100.
The rules are simple to follow:
- If the RSI number ranges above 70, it indicates over-hedging, signaling an overbought signal with a potential reversal.
- However, if the range hangs below 30, the price shows an oversold situation, hinting a retreat in the approximate future.
As a trader, you can check RSI indicators to confirm momentum of the market and make your buying and selling call. This is what makes it a great choice for both long and short term time frames, making it one of the best technical indicators in the market. If you club it with moving averages, this will strengthen its signals, making the results more accurate.
3. MACD (Moving Average Convergence Divergence) – Trend and Momentum Indicator
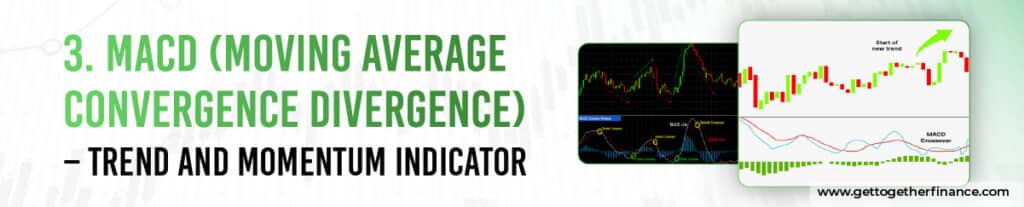
MACD is also one of the most popular choices of traders to understand in-depth insights into changing market’s strength, direction, and trend duration. This is also known as trend-following indicators which mainly uses two moving averages – one fast, one slow – in combined shows a histogram that tells the difference between them.
Now to read its codes:
- If the MACD line is above the signal line, it hints at a bullish move and tells that momentum is picking up.
- In case the MACD line falls below the signal line, it hints at a bearish trend, suggesting that a potential reversal is next.
As a trader, you can use MACD to confirm market momentum and make your buying or selling call. This makes it a great choice for options trading, where timing is crucial.
4. Bollinger Bands – Volatility Gauge
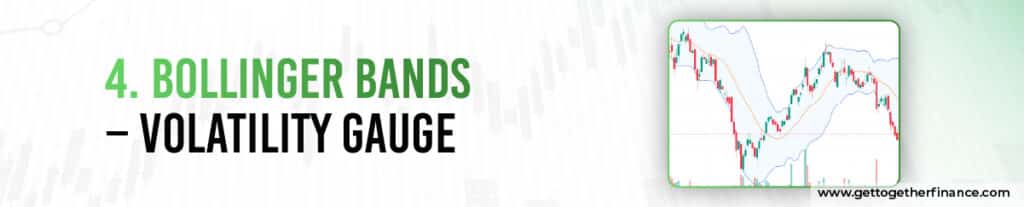
Discussing the technical indicators for trading and missing Bollinger Bands – that doesn’t sound right. Bollinger Bands include three visual lines, including upper line, lower sideline and middle line using simple moving averages. These lines create a visual like “bands” that shows the volatility of the market.
Here’s how to decode them:
- If the band shape gets borader, it shows high market volatility, hinting a potential reverse or break out.
- If the band squeezes or contracts, it hints at a consolidation period where volatility is low and traders feel calm rather than being aggressive.
Another way to read it is;
- If the price moves closer to the upper band, it could be a sign of an overbought market, signaling a reversal of price.
- If the price comes closer to lower bands, it wants to say, “Hey, we may have oversold, it’s time to bounce back.“
In any way, Bollinger Bands are one of the most useful and powerful technical indicators for trading showcasing key areas of market volatility. Through this, you can find entry, exit, and stop loss points while making timely buying or selling calls.
5. Stochastic Oscillator – Overbought/Oversold Indicator
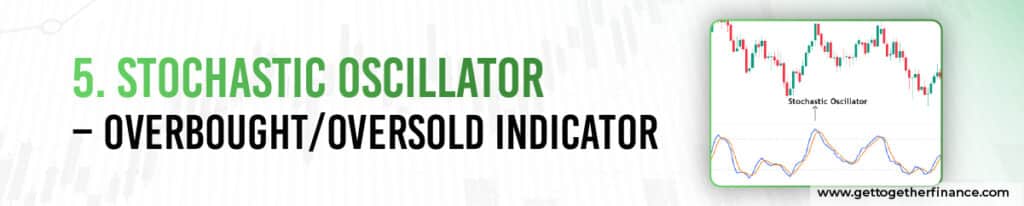
Stochastic Oscillator is a range-bound technical indicator that is popular for its precision and accuracy in assessing market conditions. The tool informs traders whether a security is oversold or overbought by letting traders know if the security is too expensive or cheap. The trick is to compare the current price to its designated low and high range over a specific time frame. The range is shown by a value between 0 and 100, but most importantly, it’s crucial to interpret it correctly and combine it with fundamental analysis.
Here is how to read its range:
- If the Stochastic Oscillator moves above 80, it signals that the asset is too expensive and it may be overbought.
- If the oscillator remains below 20, it means the asset is oversold and relatively cheaper if compared its price with its previous high and low.
The Stochastic Oscillator is one of the best technical indicators for trading, widely used to track market momentum in short-term trades. However, it is most effective when combined with other fundamental and technical analysis tools to ensure your research is robust.
6. Fibonacci Retracement – Support and Resistance Finder
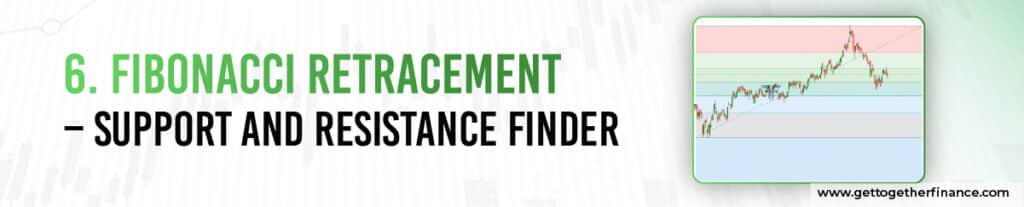
The truth is traders who love maths and Fibonacci don’t love anything else. This is a mathematical concept-based indicator i.e. widely used to find strong support and resistance levels and get great insights into potential reversal points. It uses primary Fibonacci ratios that are 23.6%, 38.2%, 50%, and 61.8% to draw horizontal lines on a chart, highlighting areas where prices might bounce or reverse.
Support and resistance is one of the most used technical analysis methods in the stock world and the Fibonacci retracement tool is one of the best ways to find key zones. These are the areas where prices are likely to retrace or reverse. Once you find a major price move, use the Fibonacci retracement tool to measure the point of price reversal. If the price reacts at one of these levels, it is your clue to mark your support or resistance, and note your entry/exit points.
Additionally, Fibonacci retracement is also used to define current market trends in combination with moving averages.
7. Volume Indicator – Trading Volume Confirmations
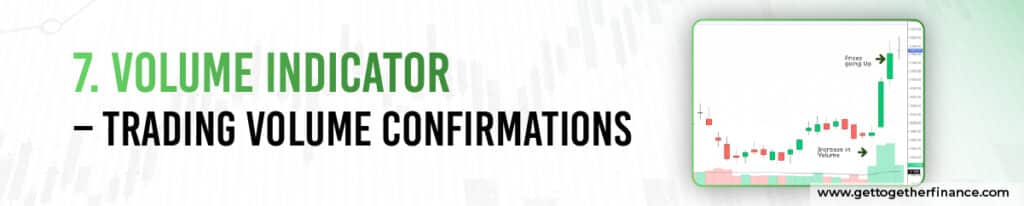
The Volume Indicator is one of the key technical indicators for trading that gives the information on how many shares or contracts are being traded over a specific period. But it doesn’t only do this. The tool gives traders a clearer picture of current market activities by showing interested buyers or sellers so you can easily understand which areas are strongly supported by high volume and which ones have lower volume than assumed. High volume shows confidence of buyers whereas low volume shows lack of traders’ commitment.
- If you spot high volume during a hike in price, it means you can step in with the conviction of buyers.
- If the price is dropping with high volume that means sellers are quite confident and price may remain there for a while.
- On the flip side, if the market shows low volume during a price move, it means there is no strong back-up and price possibly comes back to the same with a period of consolidation or reversal.
Volume tells a lot of the market and traders know the value of volume. De facto, retail investors and conventional traders most commonly prefer volume-based trading over others as they consider it more reliable and accurate. However, it is crucial to remember that the market’s nature is highly dynamic and even the strongest tool can fail before it’s volatile behavior.
8. Ichimoku Cloud – Comprehensive Trend and Support/Resistance Tool
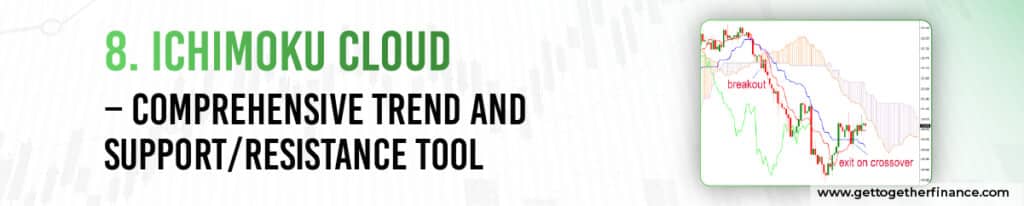
Akin to other technical indicators for trading, The Ichimoku Cloud is also great at spotting key support and resistance levels. It is considered as a momentum indicator that decodes the price movements. The meaning of ‘Ichimoku’ is ‘one-look equilibrium chart’ which is exactly why this indicator is used by traders who need a lot of information from one chart.
Here is how it works:
It plots multiple lines on the chart, named the Tenkan-sen, Kijun-sen, Senkou Span A, Senkou Span B, and Chikou Span. Together these lines create a shape like a “cloud.” This cloud helps you quickly spot areas where prices may bounce back or face resistance, as well as measure the overall market direction.
To decode it:
- If the price goes above the formed cloud, it indicates an uptrend.
- If the price drops below the cloud, this hints of a downtrend.
Remember, the thickness of the cloud is what determines the strength of support or resistance levels. A thicker cloud means stronger levels, vice versa, a thinner cloud hints at more flexibility in price movement.
Traders who love to scalp, day trade, or option trade, use Ichimoku Cloud to quote suitable entry, SL, and exit points, giving a complete view of market conditions.
9. Pivot Points – Intraday Support and Resistance Levels
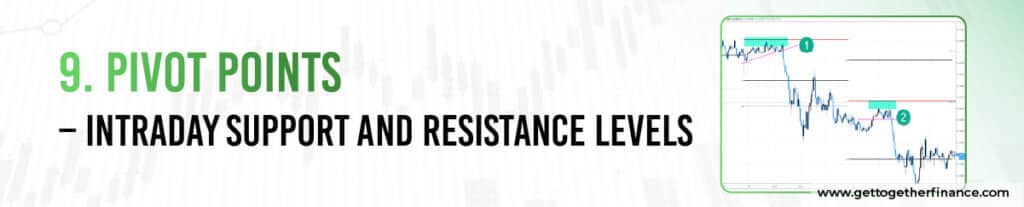
It’s time to discuss one of the interesting technical indicators and concepts – pivot points. This technical indicator is famously preferred by day traders to help spot key intraday support and resistance level. How it works is quite fascinating yet simple. It is calculated using the last day’s low, high, and closing prices that gives a central pivot point (turning point) to traders to find support/resistance zones.
- If the price goes above the marked pivot point, it boasts of upcoming bullish waves.
- But when it drops below the pivot point, it may alarm you for the upcoming bearish phase.
These levels later can be used as potential price reversals in areas where the price is expected to bounce off from during the trading period. As a trader, you can use Pivot Points to quickly pinpoint important price levels for your intraday trades. Their straightforward nature makes them beginner-friendly, and combining them with other indicators like volume or moving averages can strengthen your overall strategy.
10. On-Balance Volume – Volume Momentum Indicator
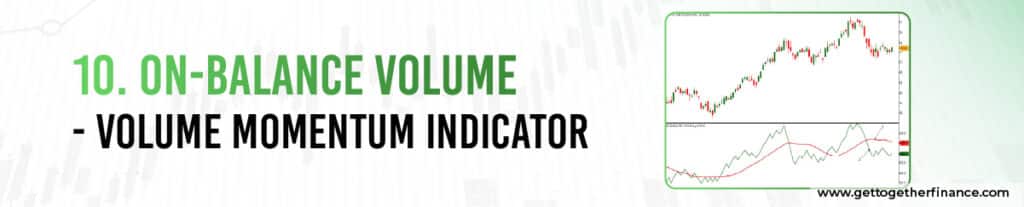
On-Balance Volume (OBV) is one of the popular volume indicators that provides traders more in-depth insights about negative and positive flow of volume over time. Popular for its effectiveness, the tool is quite beginner-friendly and works quite well on all time frames, especially weekly and daily. This is why traders prefer this to spot market divergences as well as confirm trends.
If OBV adds up volume on days when prices are moving up and remove/subtract value on days when prices fall. The process creates a cumulative line which shows market activities and traders’ sentiment.
So decoding this:
- If the OBV indicator moves upward, it’s your sign that the price may move up and an uptrend is on its way.
- Conversely, if OBV falls, this means that selling pressure is heating up and price may go lower.
If gets to decode it for trade:
- If OBV indicator moves opposite of price direction, also known as divergence, there may be a potential reversal.
- Likewise, if prices keep hitting new lows while OBV is rising, the drop may be one of the last drops and price may change its direction toward upward.
In essence, OBV not only confirms trends but also helps traders time their entries and exits with greater confidence, especially when used alongside other indicators like RSI or MACD.
Conclusion
Trading is not as simple as investing, but by equipping yourself with these top 10 trading indicators, you can quickly and effortlessly read the market and its shifting momentum. Intraday traders perform fundamental analysis and use technical indicators to set entry, exit, and stop-loss points. Technical indicators are not the primary basis for making a trade, but they work as handy tools that give you a clearer view of what has happened, what is happening, and what may happen. It’s like an alarm, but it’s up to you how you use it. Happy Trading!
FAQs
Do indicators work in trading?
Yes, indicators help traders understand market trends, momentum, and potential entry or exit points. But they are not 100% accurate and should be used alongside other strategies.
Do indicators work in the stock market?
Yes, technical indicators are broadly used in the stock market to review price movements and trends. But they work best when combined with other tools like fundamental analysis.
What are the best indicators for trading?
Some popular indicators include GTF Indicator as it clubs multiple needs of traders in one tool. Besides this, Moving Averages, RSI (Relative Strength Index), MACD (Moving Average Convergence Divergence), Bollinger Bands, and Fibonacci Retracement are also good tools to be used for trading. The best indicator depends on your trading style.
Is using indicators good for trading?
Yes, indicators can improve decision-making by providing insights into trends and momentum. But relying only on indicators can be risky, as market conditions can change unpredictably.
Which trading indicator is most accurate?
No indicator is 100% accurate, but GTF Indicator, RSI, MACD, and Moving Averages are considered reliable when used correctly. The accuracy also depends on how well traders interpret them.
Which indicator is best for long-term investment?
For long-term investing, GTF Indicator, Moving Averages (50-day, 200-day), RSI, and MACD are useful as they help identify trends and potential buying opportunities. However, fundamental analysis plays a bigger role in long-term investing.