Basics of a Tri-Star Pattern and How to Successfully Trade It
- April 20, 2025
- 507 Views
- by Manaswi Agarwal

 Instagram
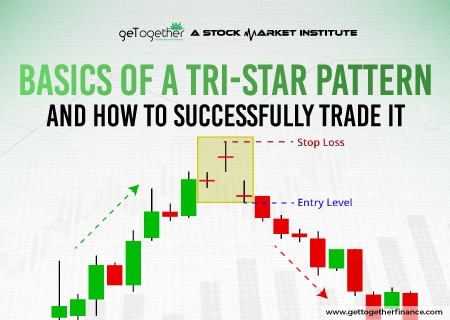
In the world of financial markets, you must have come across various trading chart patterns with a number of trading strategies. Tri-Star Pattern is one strategy that attracts you each time to trade successfully and gain expertise in the market. This pattern provides the efficacy to pick profitable opportunities as it blends uniquely with the stock market, let us understand its significance through the blog.
What is a Tri-Star Pattern?

A Tri-Star Pattern consists of three doji candlesticks that depicts either bullish or bearish moves in the market. The doji candlestick is the representation of fight among buyers and sellers in the market. When three doji candlesticks form continuously signifies undergoing indecisiveness in the market. Due to market uncertainty, the formation of star patterns from these candlesticks indicates a trend reversal which can be bullish or bearish.
Understanding Tri-Star Pattern

Tri-Star is one unique pattern of its own as it formed after the completion of a trend and potentially indicates a trend reversal in the security with the completion of three stars. A tri-star pattern forms due to the uncertainty of buying and selling in the security, but how does a tri-star actually look?
First Candle
The first doji candlestick signifies the indecisiveness in the market which is formed in the same direction of the trend.
Second Candle
The second doji candlestick forms with a gap among both the trends i.e. continued trend and trend reversal. A bearish trend takes place when the middle candle gives a gap up opening whereas a gap down opening suggests a bullish reversal in the trend.
Third Candle
The third and the final doji candle represent a change in the market sentiment. It brings in the trend reversal.
How to trade Tri-Star Pattern?
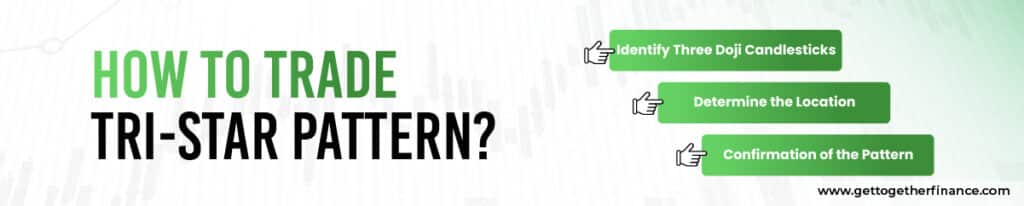
Tri-Star Pattern is widely used among traders in the stock market as it gives the signals of trend reversal in the security. This allows traders to timely execute their entry and exit points with the help of several technical indicators. To trade Tri-Star Pattern, the given steps must be followed:
Identify Three Doji Candlesticks
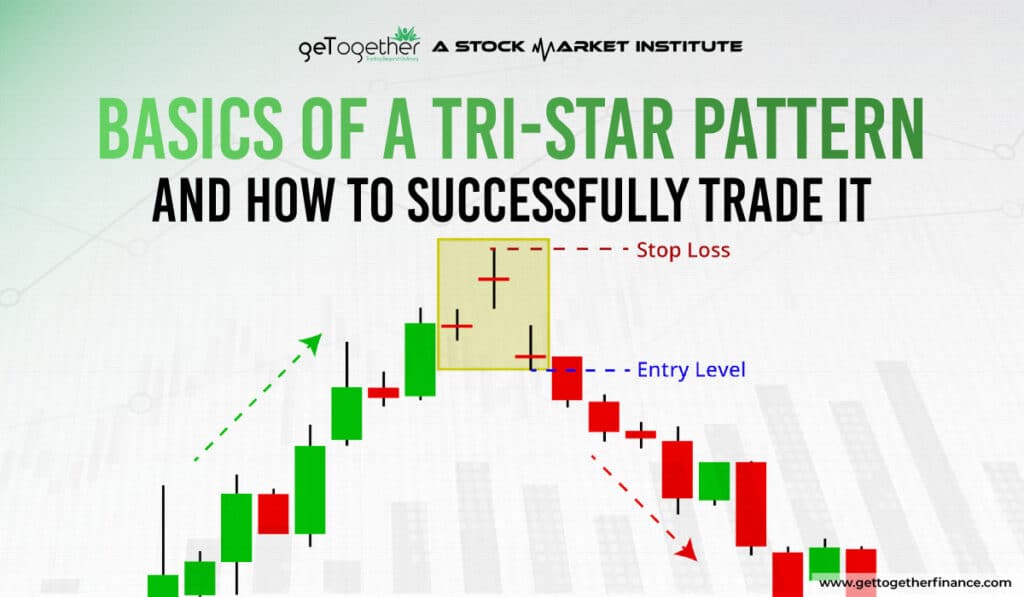
The Tri-Star Pattern consists of three doji candlesticks that are places consecutively next to each other. Looking like a star, these candlesticks are formed at the end of a trend either uptrend or downtrend indicating a trend reversal in the market. The middle candle is placed at a significant gap from corner candles.
Determine the Location
To identify the bullish or bearish trend reversal, it is essential to determine the location of the pattern in the chart. Traders make short or long positions depending on the location of the Tri-Star Pattern formation. In a downtrend, the formation of this pattern signals bullish reversal whereas in an uptrend it signifies a downward reversal in the security.
Confirmation of the Pattern
The trend reversal is confirmed with the formation of Tri-Star Pattern accompanied by other technical indicators that act as an evidence to push the prices in a favorable direction. These technical indicators include support or resistance levels, trend lines, volume patterns, etc that align with the confirmation of trade.
Tri-Star Pattern in Demand Zone
To trade a bullish Tri-Star Pattern, look for the demand zones at which the formation of three doji candlesticks like stars represents the end of the down trend. When the formation takes place with the support of demand zones of higher time frames, traders can go long for the position with further bullish sentiment in the security.
Tri-Star Pattern in Supply Zone
Trading Tri-Star Pattern in supply zone indicates bearish sentiments in the security. The tri-star is formed at the supply zone determining a strong selling pressure with a potential trend reversal in the security. This guides traders to make a short position in the security.
Consideration in Tri-Star Pattern

A Tri-Star Pattern is ideally formed on the support or resistance levels. According to technical traders a Tri-Star Pattern must fall at the resistance level to indicate a bearish move in the security. However, many times support or resistance levels are breached by the prices due to market volatility. Hence, approaching Tri-Star Pattern with support of demand and supply zones is considered to be viable. A strong bullish move is ensured when Tri-Star Pattern forms at the
demand zone indicating a trend reversal and vice versa.
Dependence on other technical indicators decreases the reliability of the pattern. It requires traders to depend on more reliable and accurate theory that can assure better risk management techniques also. In demand and supply, risk management is properly followed as traders have to exit when the prices breach the zones.
FAQs
What is a Tri-Star Pattern?
A Tri-Star Pattern represents the fight among buyers and sellers for three consecutive candles. The formation of continuous doji candlesticks represents a trend reversal in security.
When does the Tri-Star Pattern occur?
A Tri-Star Pattern occurs after the occurrence of a downtrend or uptrend in a security. This pattern indicates the end of the trend with potential trend reversal.
What is the bullish Tri-Star Pattern?
A bullish Tri-Star Pattern occurs after the end of a downtrend when the middle candle is at a significant gap from the first and the third candle.
What is a bearish Tri-Star Pattern?
A bearish Tri-Star Pattern occurs after the end of an uptrend in which the middle doji candlestick is formed at a significant gap from the first and the third candle.