What Is a V-Shaped Recovery and Why Does It Matter?


Table of Contents
ToggleOverview
What if the secret to a strong economy is its ability to bounce back from tough times, just like a rubber ball? This is where the idea of a V-shaped recovery comes in—a pattern that shows hope and strength when economies face downturns. This recovery shape looks like the letter “V,” and it has real-world effects that can influence our financial futures. Knowing what makes V-shaped recoveries tick is important for government leaders, investors, and businesses, as it can guide their choices during uncertain times. In this blog, we will explore the definition, characteristics, and real-world examples of V-shaped recoveries, highlighting their importance.
What is V-Shaped Recoveries

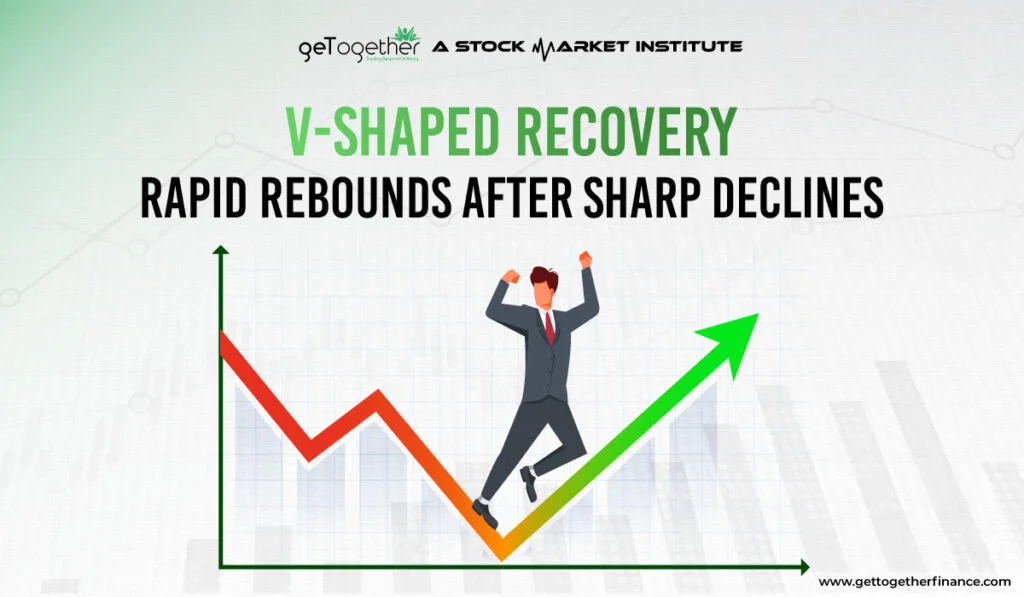
A V-shaped recovery is a way to describe what happens to an economy when it goes through a big drop and then quickly bounces back, forming a “V” shape on a graph. This pattern shows that after a tough time, like a recession or crisis, the economy can recover fast and get back to where it was before.
Economic downturns can occur for various reasons, often due to unexpected events like wars, pandemics, or natural disasters. These events can severely disrupt key economic indicators, such as:
- Gross Domestic Product (GDP)
- Stock Market Indexes
- Income Levels
- Employment Rates
- Manufacturing Output
- Retail Sales
These indicators help us understand the overall state of an economy. When one or more of these indicators are disturbed, it can lead to significant economic impacts, often seen as sharp declines or “nosedives” in economic trends.
Example of V-Shaped Recovery During COVID-19 Pandemic
A recent example is the COVID-19 pandemic in 2020, which caused a major disruption in nearly all countries. Key indicators like industrial production, employment, and GDP plummeted as the world shut down. The effects were severe and widespread, causing sharp declines in economic performance.
Identifying a V-Shaped Recovery

A V-shaped recovery is identified by a rapid bounce-back in these economic factors, signaling that the economy is quickly recovering. After hitting a low point, these indicators sharply rebound to levels seen before the downturn. This recovery pattern is the most desirable because it means the economy is getting back on track swiftly.
Achieving a V-shaped recovery usually requires strong actions from the government and often support from the private sector. These efforts are crucial to help the economy recover its losses and continue growing. A V-shaped recovery represents the best-case scenario for bouncing back from an economic downturn.
Example of V-Shaped Recovery in Indian Stock Market

A clear example of a V-shaped recovery in the Indian market is what happened after the COVID-19 pandemic hit in 2020.
In March 2020, when the pandemic started and the government imposed lockdowns, the stock market in India, measured by the BSE Sensex, dropped sharply. It lost over 8,000 points, falling to around 25,000 points by the end of March.
However, just a few months later, the market began to bounce back quickly. By December 2020, the Sensex had risen back up to over 47,000 points, showing a strong recovery.
This pattern of a big drop followed by a fast recovery looks like the letter “V,” which is why it’s called a V-shaped recovery. Several reasons helped this recovery:
- Businesses reopened as the lockdowns were lifted, allowing the economy to start moving again.
- Support from the government and the Reserve Bank of India helped boost the economy with financial aid and lower interest rates.
- Hope about vaccines being developed gave people confidence that things would get better.
While the economy faced a tough time at first, it quickly bounced back, showing a V-shaped recovery in both the stock market and the overall economy. This example highlights how quickly things can improve when conditions change for the better.
Technical Indicators To Identify V-Shaped Recovery In The Stock Market

When the stock market takes a sharp downturn, a V-shaped recovery means it bounces back just as quickly. Here are some simple technical indicators that can help you spot when the market might start recovering:
Exponential Moving Averages (20-Day and 50-Day Averages):
These are just the EMA prices of a stock over the last 20 or 50 days. If the 20-day average moves above the 50-day average, it might signal the start of a recovery. If it goes below, the market might drop more before bouncing back.
Demand And Supply Dynamics
Demand and supply zones are super helpful for traders to identify areas where there are a lot of buy or sell orders waiting. This can be especially useful when the market takes a sharp drop and is about to bounce back, forming a V-shaped recovery. Traders using a top-down approach by looking at larger time frames (like weekly or daily charts) can spot important areas with lots of pending buy or sell orders. When the market drops sharply and hits a demand zone, it’s usually a sign that buyers will jump in and push the price back up, starting the V-shaped recovery.
Relative Strength Index (RSI)
The RSI shows if the market is oversold (below 30) or overbought (above 70). If it’s below 30, the market might be due for a bounce back, signaling a V-shaped recovery.
Sectorial Analysis
Sometimes, individual sectors perform better than the broader market. In a V-shaped recovery, analyzing which sectors (like technology, finance, or energy) are bouncing back strongly can provide key insights. For example, during a recovery, certain industries might recover faster than others, giving traders clues on where to focus their investments. Watching sector-specific demand-supply zones can also give an idea of whether a V-shaped recovery is taking place in that sector.
Volume of Trades
If you see a big jump in the number of shares being traded during a downturn, it might mean the market is finding its bottom. More trading during a rise suggests a strong recovery.
B/E (Book Equity) & M/E (Market Equity) Ratio
- B/E Ratio: This compares what a company is worth on paper to what it’s selling for on the market. A high B/E ratio during a downturn might mean the stock is cheap and could recover sharply.
- M/E Ratio: This compares the market value of a company to its book value. If the market value is low compared to the book value, it might bounce back strongly when the market improves.
Book-to-Market Ratio
This is similar to the B/E ratio. A higher book-to-market ratio during a downturn might suggest that the stock is undervalued, and it could see a quick recovery.
Trendlines
Drawing a line along the tops or bottoms of price movements can help you see when a downtrend is ending. If the price breaks above a downward trendline, it could signal the start of a recovery.
Fibonacci Levels
These percentages (like 50% or 61.8%), known as Fibonacci Levels, are used to predict where the market might stop falling and start recovering. If the market bounces at one of these levels, it could indicate a V-shaped recovery.
Bollinger Bands
Bollinger Bands show how volatile the market is. If the price moves sharply outside the bands and then quickly comes back inside, it might signal that the market is about to recover.
Market Breadth
This looks at how many stocks are going up versus going down. If more stocks start moving up during a downturn, it suggests the whole market might be ready to bounce back.
By keeping an eye on these simple indicators, you can better spot when the market might start recovering quickly after a sharp drop, helping you make smarter investment decisions.
Conclusion
To wrap up, it’s important to note that the economy is in what many expect to be a V-shaped recovery after the recession caused by the COVID-19 pandemic. The pandemic led to travel restrictions, the closure of non-essential businesses, and social distancing measures, all of which have significantly impacted the economy, including stock market and global businesses.
However, efforts by governments around the world are showing signs of a quick recovery, with the second half of the “V” starting to take shape. While 2021-22 may mark a strong recovery, the exact path of the economy is still uncertain.
FAQs
Are V-shaped recoveries common?
They are relatively rare, as not all economies can bounce back quickly from a downturn. The specific conditions needed for a V-shaped recovery don’t always align.
Is a V-shaped recovery sustainable?
While the initial recovery can be strong, sustaining it depends on underlying economic fundamentals, such as consumer confidence and business investment.
Can a V-shaped recovery lead to inflation?
Yes, if demand rebounds too quickly while supply lags, it can lead to inflationary pressures.
Can a V-shaped recovery be predicted?
It’s difficult to predict with certainty, but economists look for signs like strong policy responses and resilient economic fundamentals.


 Facebook
 Instagram
 Youtube
